


Can you trust AI detectors to tell human from machine?
Our infographic lays out accuracy numbers for five leading tools and compares vendor claims to independent tests.
It shows dramatic gaps: claimed 99% vs observed 30–100%, false positives on human texts, and big drops after paraphrasing or newer models.
This matters if you grade student work, run a newsroom, or publish SEO content.
Read on to see which tools are conservative, which flip-flop, and what settings or tests to watch next.
Visual Breakdown of AI Content Detector Accuracy Metrics

The most searched comparison includes five major tools, and each one shows a different performance profile when you look at vendor claims versus independent testing. Originality.AI publishes the highest claimed accuracy at up to 99% with fewer than 2% false positives. GPTZero reports roughly 84% average confidence on straightforward AI text with a 3.3% false positive rate. Copyleaks emphasizes a 0.2% false positive rate, and Grammarly’s detector shows much lower accuracy in controlled tests at around 37–40%. Real-world testing reveals massive variability. The same AI-written article scored anywhere from 30% flagged to 100% flagged depending on which tool was used.
Detection results shift when text is rephrased or paraphrased. GPTZero maintains roughly 75–80% accuracy on paraphrased samples, while Grammarly drops to 30–60%. Tools also behave differently across AI model generations: GPTZero detects GPT-4 content at about 80% accuracy but claims over 85% on earlier models. False positives have occurred on purely human-written SEO content, historical documents, and even political speeches. One test documented Originality.AI “flip-flopping” results after minor rephrasing. Previously human-rated content later flagged as mostly AI and vice versa. That highlights the instability of single-run outputs.
| Tool | Claimed Accuracy % | Observed Accuracy % | False Positive % | Last Reported Date |
|---|---|---|---|---|
| Originality.AI | Up to 99% | Variable (30–100% range) | <2% | March 2024 |
| GPTZero | ~84% average | 75–84% | 3.3% | 2024 |
| Turnitin | Not published | Not disclosed | Documented false accusations | 2023 (limited) |
| Copyleaks | High (unspecified) | Not independently verified | 0.2% | 2024 |
| Grammarly | Not published | 37–40% | Low (not quantified) | 2024 (ZDNet benchmark) |
Accuracy Rates Across AI Detection Tools and Their Reliability
Most detection tools analyze two primary linguistic signals: perplexity and burstiness. Perplexity measures how “predictable” text is to a language model. AI-generated content tends to show lower perplexity because it follows learned patterns more closely. Burstiness tracks sentence-length variation. AI text typically shows less variation than human writing. For example, AI tends to produce sentences of similar length, while humans shift between short punchy statements and longer explanatory clauses. GPTZero explicitly uses both metrics. Grammarly relies on broader linguistic and statistical signals without publishing its exact weighting.
Benchmarking methodologies differ sharply between vendors and independent researchers, producing wide variance in reported accuracy. Internal benchmarks often use sample sizes ranging from hundreds to thousands of curated texts. Small-scale journalist tests from 2023–2024 used only a few dozen samples per tool, leading to less stable results. Independent academic reviews published in 2024 used controlled datasets. One study tested scientific abstracts and achieved 99.5% detection accuracy with zero false positives at an optimized threshold determined by Youden’s index. That same study highlighted that threshold selection matters: lowering the detection threshold catches more AI text but increases false positives.
The difference between internal vendor benchmarks and independent academic validation explains much of the reported performance gap. Vendors typically test on their own training-adjacent datasets, which can inflate accuracy figures. Independent studies use out-of-sample text types like historical literature, political speeches, casual blogs, short stories. That better represents real-world diversity. Sample size also plays a critical role: a test using 30 human-written samples (GPTZero’s published false-positive test) provides far less statistical power than a dataset of thousands of samples used in large-scale internal benchmarking.
False Positives and False Negatives in AI Content Detection

False positives occur when a detector flags human-written content as AI-generated. GPTZero reported a 3.3% false positive rate in testing. One out of thirty human-written samples including historical literature, political speeches, and news reports was incorrectly flagged. Originality.AI claims fewer than 2% false positives, and Copyleaks claims just 0.2%. Real-world examples include the U.S. Constitution being flagged as primarily AI-generated, SEO-optimized human articles mislabeled as machine-written, and educators receiving false cheating accusations from Turnitin flagging student essays.
False negatives happen when AI-generated text is classified as human-written. GPTZero documented a 35% false negative rate. Roughly one in three AI-generated pieces received a classification of 30% or lower AI probability. Paraphrasing tools such as Quillbot and Wordtune significantly reduce detectability: GPTZero’s accuracy on paraphrased content drops to roughly 75–80%, while Grammarly detects only 30–60% of paraphrased AI samples. Rephrasing even simple sentences can cause detectors to reverse their outputs entirely.
Common causes of detection errors include:
- SEO-optimized human writing that mimics low-perplexity patterns typical of AI text.
- Highly structured or formulaic human content such as legal documents, technical manuals, or policy statements.
- Paraphrasing and rewriting tools that break predictable AI patterns without changing the underlying ideas.
- Model version mismatches. Detectors trained on GPT-3 outputs struggle with GPT-4 and newer reasoning models like ChatGPT o1.
- Small or biased training datasets that don’t represent the full range of human writing styles across genres, topics, and demographics.
Comparative Performance of Detectors on Leading AI Models

Detection accuracy varies significantly depending on which AI model generated the content. GPTZero detects GPT-4 outputs at roughly 80% accuracy but claims over 85% on earlier models such as GPT-3. Grammarly shows much lower performance across all models, identifying only 37–40% of pure AI-generated text in controlled tests. Internal benchmarks from multiple vendors now include testing against Claude, Llama, Gemini (as of 2024), and the advanced ChatGPT o1 reasoning model released in December 2024 and benchmarked in 2025.
Mixed-document detection, content combining both AI and human writing, introduces additional complexity. One leading detector reported 96.5% accuracy on mixed documents in August 2024 testing. That’s a meaningful improvement over pure AI classification but still short of the 99% figures claimed for unmixed text. This capability matters most in education and publishing, where students and writers often use AI assistance for research, outlining, or editing rather than generating entire pieces.
| Model | Average Detection % | Best Tool % | Worst Tool % | Benchmark Year |
|---|---|---|---|---|
| GPT-3 | ~85% | ~99% (vendor claim) | ~37% (Grammarly) | 2023–2024 |
| GPT-4 | ~80% | ~84% (GPTZero) | ~40% (Grammarly) | 2024 |
| Claude | Not disclosed | Internal only | Not published | 2024 |
| Llama | Not disclosed | Internal only | Not published | 2024 |
| Gemini | Not disclosed | Internal only | Not published | 2024 |
Testing Methodologies Used to Measure Detection Accuracy

Internal vendor benchmarks use sample sizes ranging from hundreds to thousands of curated texts, including AI-only, human-only, and mixed-sample documents. These tests are typically conducted on proprietary datasets that may overlap with training data, potentially inflating reported accuracy. Independent academic reviews, by contrast, employ out-of-sample datasets such as scientific abstracts, historical documents, and contemporary news articles to evaluate real-world performance. A 2024 independent study used threshold optimization techniques, specifically Youden’s index, to identify the detection threshold that maximized true positives while minimizing false positives. It achieved 99.5% detection with zero false alarms on a controlled set of scientific abstracts.
Small-scale journalistic tests conducted in 2023 and 2024 used limited sample sizes, often fewer than fifty texts per tool. They included diverse content types: SEO-optimized blog posts, short stories, political speeches, historical literature, and casual social media posts. These tests highlighted wide performance variance across tools but lacked the statistical power to produce stable accuracy estimates. The difference in sample size between internal benchmarks (thousands of texts) and journalistic tests (dozens) explains much of the reported inconsistency in tool performance.
Threshold calibration plays a critical role in balancing false positives and false negatives. Lowering the detection threshold increases sensitivity, catching more AI-generated content but also flagging more human writing as false positives. Raising the threshold reduces false positives but allows more AI text to pass undetected. Independent studies specify the threshold used and report performance at multiple levels. Vendor-published benchmarks often report a single accuracy figure without disclosing threshold settings or the trade-offs involved.
Visualization Elements for an AI Detection Accuracy Infographic
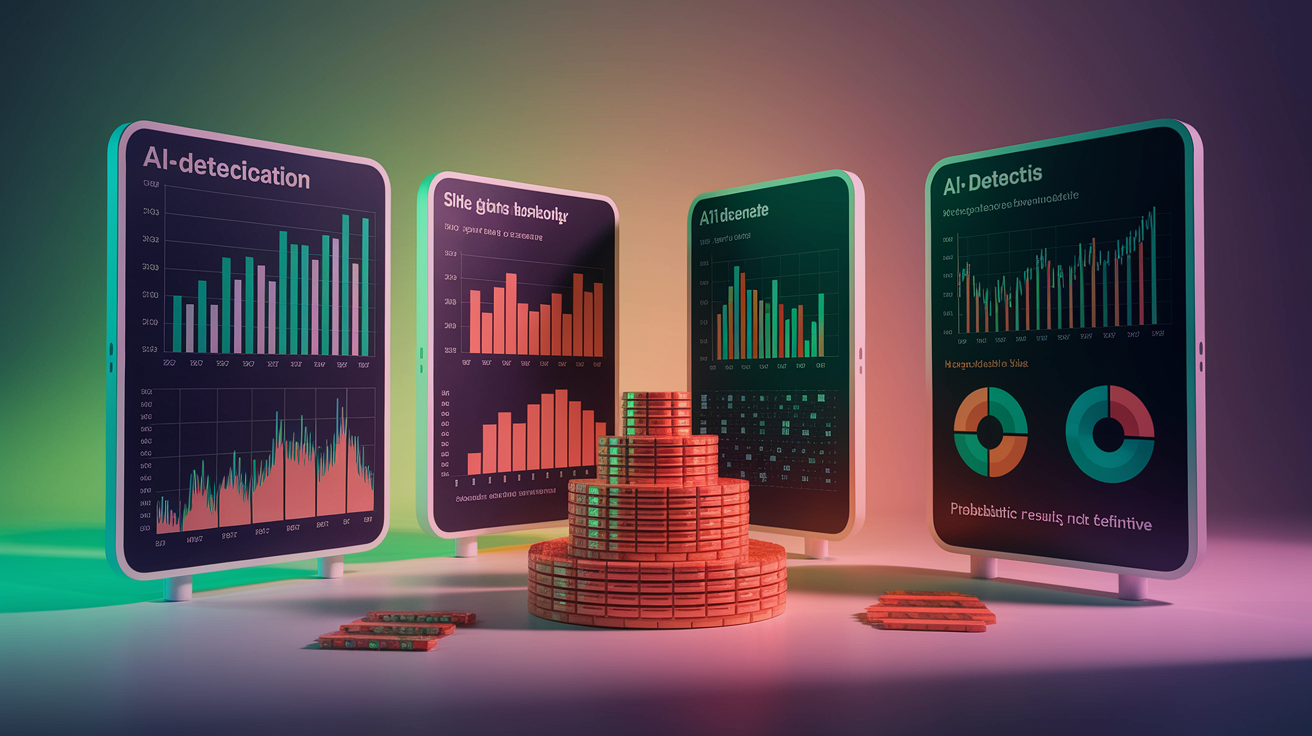
An effective AI detection accuracy infographic should prioritize comparative metrics, error rates, and model-specific performance in a format optimized for rapid comprehension.
Key visualization elements include:
- Side-by-side bar chart comparing claimed accuracy percentages versus observed accuracy for each tool, with data labels showing exact figures and benchmark dates.
- Heatmap displaying detection success by AI model (GPT-3, GPT-4, Claude, Llama, Gemini, ChatGPT o1) across multiple detectors, color-coded by performance tier.
- Boxplot or range chart illustrating inter-tool variance on identical samples, showing minimum and maximum detection scores. Example: 30% to 100% flagged for the same text.
- Stacked bar chart breaking down false positive and false negative rates per tool, with separate segments for pure AI, pure human, and mixed-document error rates.
- Annotated timeline marking major benchmark dates (2023 vendor launches, 2024 independent studies, 2025 o1 model testing, 2026 Chicago Booth benchmark) alongside model release dates.
- Small panels or callout boxes explaining perplexity and burstiness with numeric examples, such as “Perplexity score of 12 (typical AI) versus 45 (varied human writing).”
Color-coding should follow a consistent palette: green for metrics above 90% accuracy or below 2% false positives, amber for mixed or moderate results (70–89% accuracy, 2–5% FP), and red for high error risk (below 70% accuracy or above 5% FP). All charts should include exact percentages, sample sizes where available, and the last reported benchmark date. Data labels must be large enough to read on mobile screens. Every visual should carry a footnote stating “Probabilistic results, not definitive” to reinforce that no tool guarantees 100% accuracy.
Practical Use Cases and Limitations of AI Detection Accuracy Data

AI detection tools function best as editorial red-flag systems rather than final arbiters of content origin. In education, tools like Turnitin have produced documented false accusations of cheating, damaging student-teacher relationships and academic records. Mixed-document detection accuracy reaches up to 96.5% in some tools, but that still means nearly four in every hundred assessments may be incorrect when applied at scale across thousands of student submissions.
Industry best practices recommend running at least two detectors per content piece and treating all outputs as probabilistic scores requiring human review. A single detector showing 85% confidence that text is AI-generated doesn’t constitute proof. It indicates a likelihood that should prompt further investigation, such as requesting documentation of the writing process, comparing the piece to previous work, or conducting a brief interview. No detection tool should be used as the sole basis for disciplinary action, contract termination, or content rejection.
Recommended best practices for using AI detection accuracy data:
- Run a minimum of two independent detectors per content piece and compare results. Significant disagreement between tools signals uncertainty.
- Treat detection scores as probabilistic estimates, not binary verdicts. An 80% AI score means “likely contains AI elements,” not “definitely AI-written.”
- Establish a human review process for all high-stakes decisions, including academic integrity cases, contract disputes, and content authenticity verification.
- Document detection thresholds, tool versions, and benchmark dates used in any formal assessment to enable later audits and appeals.
Human oversight remains essential because detectors lag behind model improvements. New AI models are released more frequently than detection tools are updated. Monthly or quarterly model refreshes versus annual detector retraining cycles. The ongoing arms race between content generators (GPT-3, GPT-4, Claude, Gemini, ChatGPT o1) and detection algorithms means that accuracy figures published today may not reflect performance against next quarter’s models. Focus on content quality, expertise, and audience value (E-E-A-T) rather than optimizing to avoid detection scores. Well-researched, expert-authored content will outperform both purely AI-generated and detector-gaming strategies over time.
Final Words
This post mapped visual accuracy comparisons for GPTZero, Originality.AI, Turnitin, Copyleaks, and Grammarly, explained why numbers vary, showed common false positives, and outlined how benchmarks are run and visualized.
Bottom line: treat detectors as red flags, not verdicts. Run two tools when stakes are high, watch for rephrasing and dataset limits, and label uncertainty clearly.
Use the ai-generated content detection accuracy infographic as a practical checklist for reports and presentations. It’ll help you spot gaps fast and avoid overclaiming.
FAQ
Q: What accuracy rates do top AI detection tools claim and show?
A: The claimed and observed accuracy vary: Originality.AI claims up to 99% with <2% false positives; Copyleaks claims 0.2% FP; GPTZero ~84% on pure AI; Grammarly ~37–40%; observed ranges 30–100%.
Q: Why do accuracy rates differ between tools?
A: Accuracy rates differ because tools use different signals (perplexity, burstiness), training sets, thresholds, and sample sizes; vendors’ internal benchmarks often outperform independent studies due to testing conditions.
Q: What causes false positives and false negatives in detection?
A: False positives and negatives come from short or SEO-optimized human text, historical or stylistic writing, paraphrasing tools, mixed human+AI content, and threshold miscalibration during testing.
Q: How do detectors perform across different LLMs like GPT-3, GPT-4, Claude, Llama, and Gemini?
A: Detector performance varies by model: GPTZero finds GPT-4 near 80% and earlier models above 85%; other tools show much lower recall, producing wide differences by model and tool.
Q: How are detection accuracy tests conducted?
A: Detection tests use curated AI-only, human-only, and mixed samples; internal tests span hundreds to thousands of texts, while independent studies optimize thresholds (Youden’s index) and use varied document types.
Q: How should educators and publishers use detection results?
A: Detection results should be treated as red flags, not proof: run two tools, add manual review, check sources and style, and avoid punishment based on a single automated flag.
Q: What visualization elements should an accuracy infographic include?
A: Infographics should include side-by-side bar charts for accuracy, false-positive heatmaps, boxplots for variance, annotated timelines, a comparison table, and a clear color legend (green/amber/red).
Q: What columns and notes should a comparison table show?
A: A comparison table should list Tool, Claimed Accuracy %, Observed Accuracy %, False Positive %, and Last Reported Date, plus notes on observed ranges and testing variability.
Q: Are AI detection tools reliable enough for formal disciplinary decisions?
A: Detection tools aren’t reliable enough alone for formal decisions; combine multiple detectors, human review, source checks, and an appeal process before taking disciplinary action.