

Which company actually owns AI: the one with the fanciest demo or the one stacking patents?
This infographic lays out AI patent filings by company from 2018–2025, showing counts, shares, yearly trends, tech slices, and filing geography.
You’ll get a clear ranking, where each firm focuses (NLP, vision, healthcare, finance, ADAS), and when filings spiked around key product launches.
Read on to see who’s leading, who’s catching up, and what those numbers mean for competition, partnerships, and product roadmaps.
Visual Overview of AI Patent Filings by Company
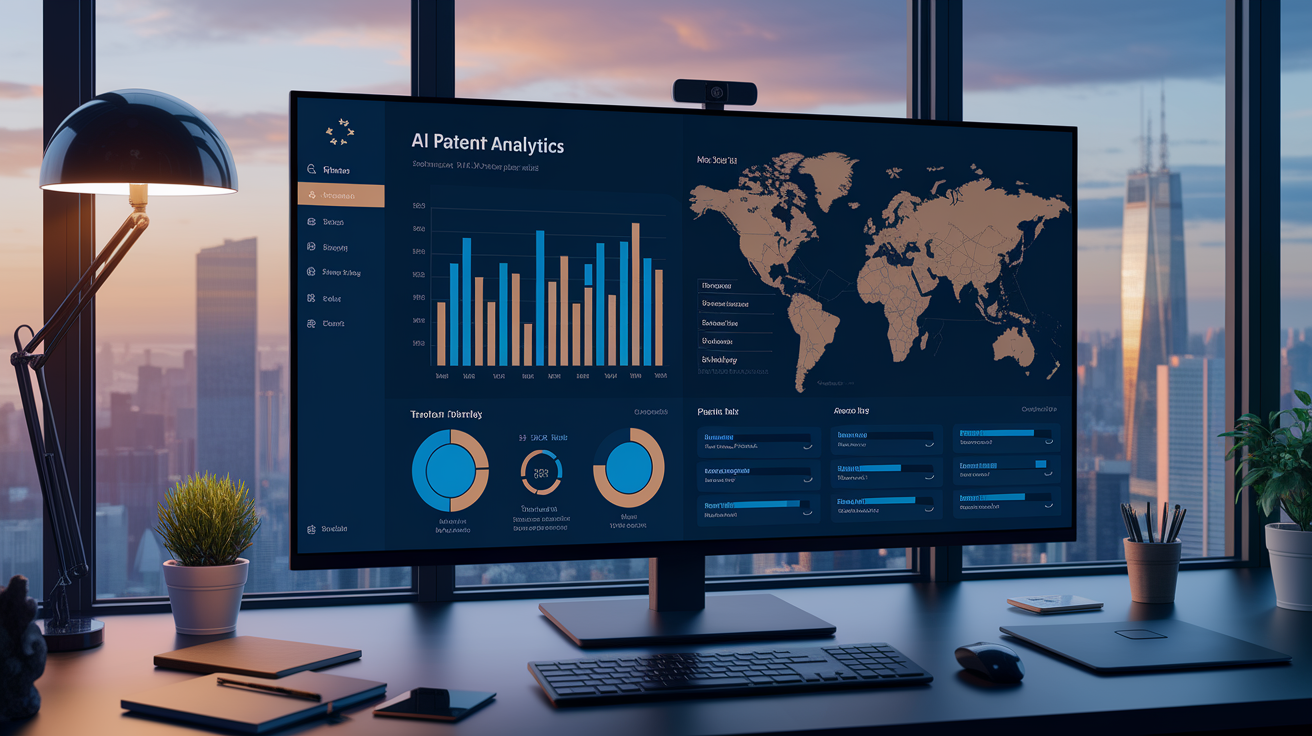
A solid AI patent infographic needs to start with a top-10 horizontal bar chart showing how many patents each company filed and what percent of the total that represents. Put that bar chart next to a KPI panel that sums up total filings, granted patents, compound annual growth rate, the year with the most filings, median patent family size, and forward citation counts. Right below that, stack an area chart tracking year-over-year filings from 2018 through 2025 so you can see which companies accelerated and when. Add a pie chart breaking the portfolio into chunks like Natural Language Processing, Computer Vision, Machine Learning algorithms, Recommendation Systems, Autonomous Driving/ADAS, Healthcare/Diagnostics, and Fraud Detection/Finance. Then drop in a choropleth world map showing where filings concentrate—United States, China, the European Union, Japan, South Korea—and mark each company’s top priority country.
The time window runs 2018 to 2025 because that’s when major product launches happened and generative AI filings really took off. You’ll pull data from the United States Patent and Trademark Office, WIPO PATENTSCOPE, the European Patent Office, Google Patents, and PATSTAT/Lens. Count unique patent families instead of individual documents so you don’t double-count the same invention filed in multiple places. Put the extraction date and counting method in a footnote box so anyone can reproduce your numbers.
Annotations turn data into story. Call out milestone product launches on the timeline: Gemini in December 2025, Copilot in November 2023, Watsonx.ai in May 2023, Microsoft’s OpenAI partnership in January 2023. Keep color-coding consistent across every chart. If Google is blue in the bar chart, it’s blue in the area chart and the pie slice. Show both absolute counts and percentages, and only use log-scale when linear bars become unreadable.
Six visual pieces you need:
- Ranked horizontal bar chart (top 10 companies, counts and percent share)
- Stacked area chart (2018 to 2025 annual filings by company)
- Pie chart (AI patent share by subcategory: NLP, CV, ML, recommendations, healthcare, finance, automotive)
- Choropleth world map (priority country concentration: US, CN, EU, JP, KR)
- KPI panel (total filings, granted count, CAGR, top filing year, family size, citations)
- Product launch timeline with dates linked to each company
Company Rankings for AI Patent Filings
Use unique patent family counts as your metric. That way a single invention filed in five countries only gets counted once. Google sits at the top with 1,837 AI patents—about 50 percent more than Microsoft and nearly double IBM’s total. Samsung and Huawei come next, reflecting big bets on consumer electronics and telecom infrastructure. Further down you’ve got Amazon, NVIDIA, IBM, and a group of specialists filing heavily in narrow lanes like autonomous driving or healthcare diagnostics. OpenAI jumped to 39 patents from fewer than five the year before, which is a strategic shift considering they usually emphasize model releases over traditional IP.
Absolute numbers only tell half the story. Percent share shows you how concentrated things are: the top five assignees grab more than 40 percent of total filings in most years. Display both measures together—bar length for absolute count, data label for percentage. Methodology notes should clarify that family counting avoids duplication, granted patents are separate from pending applications, and the dataset only includes filings classified under AI-relevant IPC and CPC codes.
| Company | Notable AI Patent Focus | Relative Rank Insight |
|---|---|---|
| NLP (BERT), multi-modal (Gemini), speech recognition | Global leader; ~50% ahead of Microsoft | |
| Microsoft | Text generation, Azure ML, Copilot integration | Second tier; OpenAI partnership Jan 2023 |
| IBM | Healthcare diagnostics, fraud detection, Watsonx.ai | Strong vertical focus; roughly half of Google |
| NVIDIA | Video/image generation, GPU-accelerated training, ADAS | Hardware-software integration; top in video patents |
Year-by-Year AI Patent Filing Trends
A stacked area chart from 2018 through 2025 shows when each company ramped up and which years saw the steepest climbs. The KPI panel should report a compound annual growth rate for total AI filings, usually 30 to 40 percent over the past decade. Generative AI subcategories grow even faster—often above 50 percent CAGR. The top filing year, usually 2022 or 2023, lines up with when large language models and diffusion-based image generators went into production. Mark product launches on the same timeline so you can connect patent activity to commercial milestones: Microsoft’s early 2023 spike aligns with the OpenAI partnership in January, and Google’s December 2025 Gemini launch follows a sustained filing increase through 2024.
Comparing year over year highlights competitive moves. A company that files heavily one year but tapers the next might be consolidating around core tech. Sustained acceleration suggests ongoing R&D spend. Split the area chart by company with consistent colors so readers can trace one organization’s path across the entire window.
Four trend insights to include:
- Total AI patent applications grew at about 31 percent CAGR over ten years; grants grew at 38 percent CAGR
- Generative AI applications accelerated at 52 percent CAGR; grants at 58 percent CAGR over the same stretch
- Peak filing year (typically 2022 or 2023) matches productization of large-scale transformer models
- Launch date annotations (Watsonx.ai May 2023, Copilot November 2023, Gemini December 2025) show filing-to-market lag
AI Patent Subcategory Breakdown by Company

Segment the entire patent pool into clear domains: Natural Language Processing, Computer Vision, Machine Learning algorithms, Recommendation Systems, Autonomous Driving/ADAS, Healthcare/Diagnostics, and Fraud Detection/Finance. Each slice shows count and percentage, with a legend mapping colors to categories. Stacked bars or small multiples then break down each company’s portfolio by these same categories, revealing where they specialize. NVIDIA leads in video and image patents, reflecting its GPU roots and investment in generative image models plus autonomous vehicle perception. Microsoft dominates text generation, aligned with Copilot and Azure OpenAI. Google holds the largest speech recognition portfolio, built on decades of voice assistant and transcription work.
IBM concentrates on healthcare diagnostics, personalized medicine, and fraud detection, consistent with the Watsonx.ai launch in May 2023 and longtime enterprise analytics focus. Adobe files heavily in images, text, and video, supporting creative-cloud tools that now embed generative fill and text-to-image features. Intel emphasizes images and video but shows lower generative AI focus compared to peers, concentrating instead on hardware acceleration and edge deployment. OpenAI’s 39 patents span machine learning infrastructure, discourse representation (CPC G06F 40/30), software engineering for code generation, information retrieval, and neural network architectures.
Subcategory mapping uses keyword extraction combined with IPC and CPC classification codes. G06N 5/00 covers rule extraction from data, G06F 40/30 targets discourse and dialog, G06F 9/4881 relates to program initiating and switching. The infographic footnote should list the primary codes used to define each category so readers understand how boundaries were drawn.
Five subcategories for the breakdown:
- Natural Language Processing (NLP): transformers, language models, text generation
- Computer Vision (CV): object detection, image segmentation, generative imaging
- Machine Learning algorithms: training methods, optimization, neural architecture search
- Recommendation Systems: collaborative filtering, personalized ranking, content discovery
- Healthcare/Diagnostics: medical imaging, drug discovery, personalized medicine
Geographic Distribution of Company AI Filings
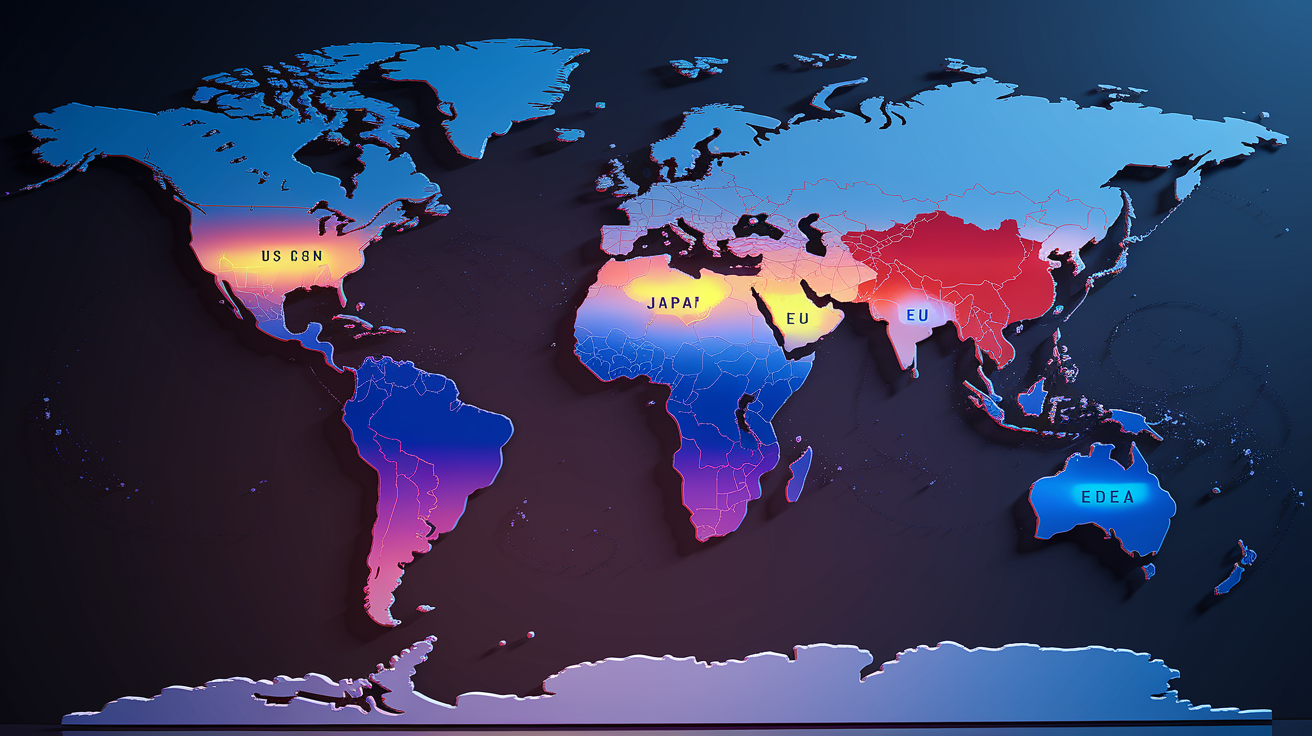
A choropleth world map color-codes countries by filing intensity. The United States, China, the European Union, Japan, and South Korea typically show the darkest shading. For each major company, a small icon or annotation on the map marks its top priority country—the jurisdiction where it files first or most often. U.S. corporate concentration is obvious: IBM, Microsoft, Google, Amazon, and NVIDIA all prioritize USPTO filings, often before seeking protection in China or Europe. Chinese filers like Huawei and Tencent show the reverse pattern, filing domestically first and expanding internationally only for flagship inventions. DeepSeek, with a single March 2024 application for a model training dataset construction method (classified under G06N 5/00), has filed only in China so far, suggesting early-stage or region-specific strategy.
Geographic patterns also reveal policy and market factors. China’s AI patent share exceeded 50 percent of global grants in 2022, reflecting government incentives, university participation, and a filing culture that values volume alongside novelty. European filings remain smaller in absolute terms but often signal intent to commercialize in high-regulation markets where data protection and algorithmic transparency rules are strict. The map should include a small legend explaining that “priority country” means the first jurisdiction where protection was sought, which typically indicates the inventor’s home base or primary commercial market.
| Country | Notable Pattern | Example Company |
|---|---|---|
| United States | Corporate concentration among tech giants | Google, Microsoft, IBM, NVIDIA |
| China | Distributed filings across government, universities, firms | Huawei, Tencent, DeepSeek |
| European Union | Focused on high-regulation markets; lower volume | Siemens, SAP (not top-tier in AI count) |
| Japan / South Korea | Consumer electronics and robotics emphasis | Samsung, Sony, LG |
Company Mini-Profiles for AI Patent Infographics

Each mini-profile panel pairs a company logo with a bulleted summary of flagship AI products, patent focus areas, and launch dates. Icons or small product screenshots help readers connect abstract patent counts to real software and services. These profiles sit in a grid or carousel format for quick comparison across six major players.
BERT (NLP research model) and Gemini (multi-modal assistant launched December 2025) anchor Google’s portfolio. Speech recognition, discourse representation, and large-scale transformer architectures dominate its filings.
Microsoft
OpenAI partnership announced January 2023; Copilot launched November 2023. Filings concentrate on text generation, Azure Machine Learning infrastructure, and enterprise integration of large language models.
IBM
Watsonx.ai launched May 2023. Patent focus spans healthcare diagnostics, personalized medicine, fraud detection, and enterprise analytics, with significant activity in speech, text, and video processing.
Amazon
Echo and Alexa voice assistants; AWS machine learning services. Filings cover conversational AI, logistics optimization, supply-chain prediction, and cloud-based training infrastructure.
OpenAI
Patent count grew from fewer than five to 39 in the latest window. Core areas include machine learning infrastructure, discourse/dialog representation (G06F 40/30), software engineering for code generation, information retrieval, and neural networks; company states defensive patent intent.
NVIDIA
GPUs and CUDA platform. Filings emphasize AI computing hardware, video and image generation, autonomous driving perception stacks, and real-time rendering for generative models.
Industry Use-Case Panels for AI Patents
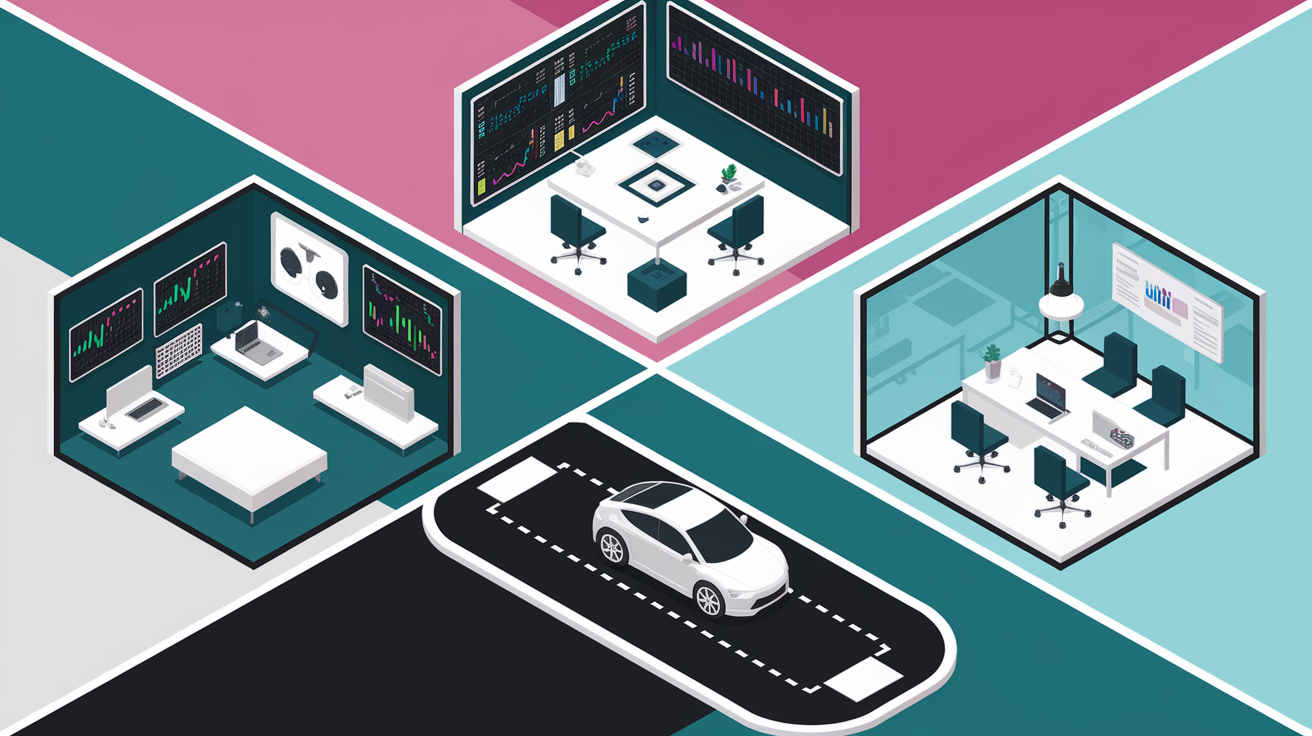
Industry snapshots translate abstract patent categories into real applications. A healthcare panel highlights diagnostic imaging algorithms, drug-molecule generation, and personalized treatment recommendations, with IBM and Google as leading filers. The finance panel covers fraud detection, algorithmic trading, credit-risk modeling, and anti-money-laundering systems, often filed by IBM, Mastercard, and Visa. An automotive panel focuses on autonomous driving, advanced driver-assistance systems, sensor fusion, and path planning, dominated by NVIDIA, Waymo (a Google subsidiary), and traditional automakers. A legal-tech panel illustrates contract analysis, e-discovery, and case prediction, with smaller specialist firms joining IBM’s portfolio.
Each panel should include one or two concrete patent examples—short descriptions and filing dates that anchor the category. “Google’s agentic conversational interface for multi-turn task execution, filed March 2023” or “NVIDIA’s prompt generator for video synthesis, pending review.”
Four key sectors and example patent themes:
- Healthcare: diagnostic imaging, drug discovery, personalized medicine (IBM Watsonx.ai focus)
- Finance: fraud detection, algorithmic trading, credit-risk modeling (IBM, Mastercard)
- Automotive: autonomous driving, ADAS, sensor fusion (NVIDIA, Waymo)
- Legal: contract analysis, e-discovery, case prediction (IBM, specialist legal-tech startups)
Legal and IP Considerations in AI Patent Infographics

AI inventions need to satisfy three patentability criteria: novelty (the invention is new), non-obviousness (it represents a meaningful technical advance), and utility (it has a practical application). Many AI patents involve mathematical relationships or algorithms, which get treated as abstract ideas under patent law in several jurisdictions and face heightened scrutiny during examination. The infographic should include a compact legal note explaining these thresholds and acknowledging that jurisdictional interpretations vary. What qualifies in the United States may not pass in Europe or China.
Licensing adds commercial context. Exclusive licenses grant a single entity the right to use the patent, often for higher upfront fees or royalties. Non-exclusive licenses allow multiple parties to practice the invention, spreading risk and revenue. Territorial scope defines where protection applies, and royalty structures can be fixed, percentage-of-revenue, or tied to usage metrics like API calls. Litigation risk remains a factor: high citation counts suggest foundational patents that competitors may challenge, while low-quality grants can invite invalidation proceedings.
Agentic AI (systems that autonomously plan and execute multi-step tasks) represents 5 percent of global AI patent filings and 7 percent of U.S. applications in the past year. Google, NVIDIA, and DeepMind lead globally; in the United States, Intel files more agentic patents than Microsoft. This category will likely grow as voice assistants and enterprise automation tools adopt more complex reasoning.
Four key legal notes for the infographic:
- AI patents must demonstrate novelty, non-obviousness, and utility; abstract-idea rejections are common
- Licensing terms vary by exclusivity (sole vs. multiple licensees), territoriality (country or region), and royalty structure
- Litigation risk increases with forward citations and foundational-technology claims; companies monitor competitor grants
- Agentic AI share (5 percent global, 7 percent U.S.) signals emerging category with Google, NVIDIA, IBM as early leaders
Data Sources, Methodology, and Extraction Notes

The infographic needs to cite primary patent databases: the United States Patent and Trademark Office, WIPO PATENTSCOPE, the European Patent Office, Google Patents, and PATSTAT or Lens for global family aggregation. The extraction date should appear in the footnote so readers know how current the snapshot is. Each patent entry in the underlying dataset includes priority year (the year of first filing anywhere in the world), unique family identifier, granted versus pending status, forward citation count, IPC and CPC classification codes, and the name of the assignee organization. The data provider’s coverage surpasses 25,000 licensing agreements, a figure that establishes credibility and breadth.
Subcategory mapping combines keyword searches with classification codes. Natural Language Processing patents match keywords like “transformer,” “language model,” and “tokenization” and align with CPC codes G06F 40/30 (discourse representation) and G06N 3/08 (neural networks). Computer Vision filings include “object detection,” “image segmentation,” and “generative adversarial network” alongside codes G06T (image processing) and G06K 9 (pattern recognition). Machine Learning algorithm patents use G06N 20 (machine learning) and related subclasses. Healthcare and Finance categories layer domain-specific codes like A61B (medical diagnostics) and G06Q 40 (finance).
Three methodological clarity points:
- Unique patent families counted to avoid duplication across multiple jurisdictions
- Classification relies on IPC/CPC codes plus keyword extraction for NLP, CV, ML, healthcare, finance, automotive, and legal categories
- Extraction date, source databases, and counting rules (family vs. document) displayed in footnote for full transparency
Final Words
The infographic lays out company rankings, yearly trends (2018–2025), subcategory shares, a world heatmap, KPI panels, and annotated product launches so readers can compare filings quickly.
It also covers data sources, counting method (family vs document), mini-profiles, and IP notes on novelty, licensing, and litigation risk.
Use the ai patent filings by company infographic as a single snapshot to spot who’s investing in NLP, CV, or healthcare and to plan IP, product, or research moves. It’s a practical map for your next step.
FAQ
Q: What visual elements must the AI patent filings infographic include?
A: The main infographic should include a top‑10 horizontal bar with counts and percent share, a stacked 2018–2025 area chart, a subcategory pie, world heatmap, KPI panel, and product launch annotations.
Q: How should rankings be calculated and shown?
A: Rankings should use patent family counts for unique inventions, show absolute counts plus percent share, and label relative insights (Google leads, Microsoft, IBM gaps) with the counting methodology noted.
Q: What time window and data sources should be used?
A: Use 2018–2025 as the time window and source filings from USPTO, WIPO PATENTSCOPE, EPO, Google Patents, plus PATSTAT/Lens; display the extraction date and coverage notes.
Q: How should year-by-year filing trends be visualized and annotated?
A: Yearly trends should be a stacked area chart (2018–2025) with CAGR in the KPI panel, annotated launch dates, and highlighted milestone years like the top filing year.
Q: How should patent subcategories be broken down by company?
A: Break subcategories into NLP, computer vision, ML algorithms, recommendations, autonomous driving/ADAS, healthcare, and finance; show company-level shares and label dominant domains (e.g., NVIDIA—vision).
Q: How should geographic distribution of filings be shown?
A: Map filings with a choropleth for US, China, EU, Japan, and Korea, annotate each company’s top priority country, and flag firms with narrow jurisdiction strategies.
Q: What should company mini-profiles contain?
A: Mini‑profiles should pair a one‑sentence product link with patent focus, include launch dates (Gemini Dec 2025; Copilot Nov 2023; Watsonx.ai May 2023), and note patent counts.
Q: Which industry use-case panels are required?
A: Industry panels must snapshot healthcare diagnostics, finance fraud detection, automotive ADAS, and legal analysis, linking each to typical patent themes and example company contributors.
Q: What legal and IP information should accompany the infographic?
A: Legal notes should explain novelty/non‑obviousness/utility criteria, list licensing terms and territoriality, flag litigation risk, and show agentic AI filing shares (global 5%, US 7%).
Q: What methodology and metadata need to be documented?
A: Methodology must state databases used, priority year and family-count rules, granted vs pending status, citation counts, CPC/IPC mapping for categories, and display the extraction date.