


Think AI startups raise money like regular software companies? Think again.
AI companies often need bigger early rounds because model training, GPU bills, and hiring ML talent push costs up fast.
This infographic lays out the full funding journey, from Pre-Seed to IPO, on one clear horizontal timeline.
You’ll see typical funding ranges, equity dilution, investor types, valuations, stage timelines, and the specific AI line items (compute, data, model costs) that change the math.
Read on to get a quick visual map that helps founders, investors, and operators plan realistic raises and avoid surprise cash shortfalls.
Visual Overview of AI Startup Funding Stages in Infographic Format
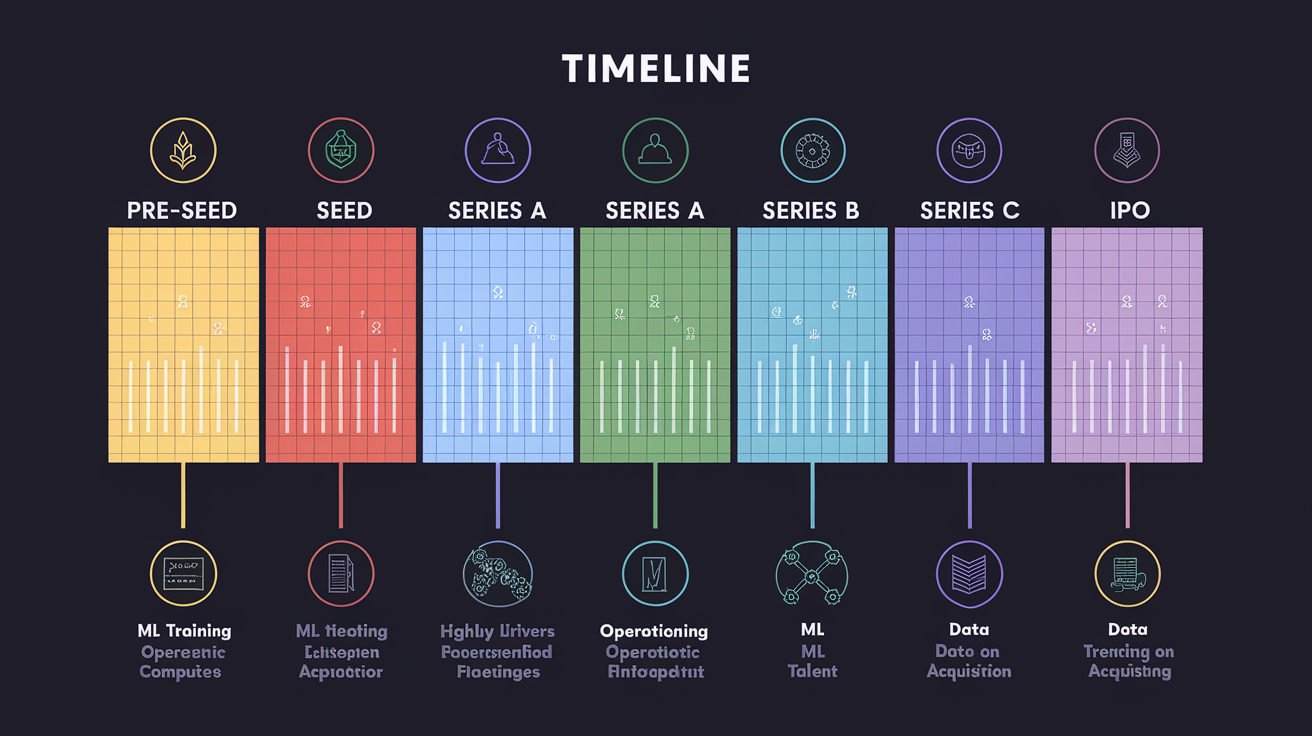
An AI startup funding stages infographic plots the full capital journey on one horizontal timeline, showing how a company moves from idea to public market. The visual runs Pre-Seed → Seed → Series A → Series B → Series C → IPO, with each stage in its own color-coded panel listing five metrics: typical funding range, expected equity dilution, main investor types, company valuation, and key milestones. For AI startups, the infographic needs cost breakdowns for model training, operational compute, machine learning talent, and data acquisition, since those expenses push founders to raise bigger rounds or stretch timelines between stages. A horizontal timeline bar shows months or years in each stage (Pre-Seed 6–12 months, Seed 12–18 months, Series A 12–24 months, Series B 18–36 months, Series C 12–36 months), giving people a clear sense of pace.
Every useful funding infographic shows:
- Funding per stage (Pre-Seed $50K–$1M, Seed $500K–$5M, Series A $3M–$15M, Series B $10M–$50M, Series C $30M–$150M and up).
- Equity dilution percentages (5–15% at Pre-Seed, 10–25% at Seed, 15–25% at Series A and B, 10–20% at Series C).
- Investor categories (angels and accelerators at Pre-Seed, seed VCs at Seed, venture firms at Series A, growth VCs and corporate VCs at Series B and C).
- Valuation ranges (Pre-Seed $1M–$6M, Seed $3M–$15M, Series A $15M–$50M, Series B $50M–$200M, Series C $150M–$1B+).
- Milestones before the next round (prototype and early validation at Pre-Seed, MVP in market at Seed, product-market fit at Series A, enterprise contracts and scaling at Series B, profitability trajectory and global expansion at Series C).
- AI cost drivers (model training $10Ks–$1M+, compute $10Ks–$100Ks monthly, ML engineering talent $150K–$400K annually).
AI costs change both the size and timing of raises. Training a production language model or vision system can cost hundreds of thousands to over a million, so AI founders often need larger Seed or Series A rounds than traditional SaaS startups at the same milestones. Operational compute expenses scale with users, meaning revenue has to grow fast enough to cover GPU cluster bills that hit five or six figures per month. Talent costs sting harder because senior machine learning engineers and research scientists pull total comp packages two to three times what typical software engineers get. When an infographic includes AI line items (compute budget, data labeling spend, model retraining cadence), it helps investors and founders set realistic fundraising targets and avoid running out of cash before the next milestone.
Pre-Seed to Seed AI Funding Stages Breakdown

Pre-Seed covers the earliest work: turning an idea into a working prototype and gathering initial proof that someone will pay. Founders usually raise $50K to $1 million, giving away 5–15 percent equity to angels, accelerators, or pre-seed micro-funds, and the company gets valued between $1 million and $6 million. At this stage, the goal is proving the founding team can build something, not scale it. Teams are small (often just founders plus one or two early engineers), and the main deliverable is a prototype or MVP showing the core AI capability works (a model that classifies images with decent accuracy, or a chatbot that answers domain questions better than keyword search). For AI startups, Pre-Seed milestones include assembling a clean training dataset, running initial model experiments, and securing early design-partner feedback confirming the AI output is actually useful.
Seed funding shifts from “does it work” to “will people use it.” Rounds go from $500K to $5 million, dilution sits between 10 and 25 percent, and valuations climb to $3 million–$15 million. Investors move from individual angels to seed-stage venture firms and angel syndicates. The company needs an MVP in market (real users or paying customers, even if small) and early proof of unit economics (cost to acquire a customer, lifetime value, churn). AI Seed milestones include running the model in production, establishing a data pipeline that updates training sets regularly, and proving inference costs per user are manageable. Data labeling and fine-tuning can reach tens of thousands to over a million dollars depending on dataset size, so Seed-stage AI companies often put a big chunk of their raise into data infrastructure and quality assurance instead of marketing or sales.
| Stage | Funding Range | Equity Dilution | Typical Valuation | Key Milestones |
|---|---|---|---|---|
| Pre-Seed | $50K–$1M | 5–15% | $1M–$6M | Prototype, founding team, early AI model proof, initial customer interviews |
| Seed | $500K–$5M | 10–25% | $3M–$15M | MVP in market, initial paying customers, basic unit economics, production ML pipeline |
Series A, Series B, and Series C Funding Visuals for AI Startups

Series A happens when a company has proof of product-market fit and needs capital to scale operations. Raises go from $3 million to $15 million, dilution runs 15–25 percent, and valuations land between $15 million and $50 million. Investors are traditional venture firms looking for repeatable revenue, a growing customer base, and a path to tens of millions in ARR. Main milestones are a scalable sales process, a product customers renew or expand, and infrastructure that can handle 10x user growth without falling over. For AI startups, Series A also means proving ML models are reliable for production (accuracy is stable, latency is acceptable, and the team has automated retraining and monitoring). Compute and infrastructure costs often jump here because usage scales faster than revenue, so AI companies raise at the higher end of the Series A range to cover 12–18 months of runway including GPU cluster expansion and more ML engineering hires.
Series B is about scaling revenue and capturing market share. Funding ranges from $10 million to $50 million, dilution stays around 15–25 percent, and valuations rise to $50 million–$200 million. Investors include growth-stage VCs and corporate venture arms. The company should have large enterprise contracts, geographic expansion underway, and operational systems supporting hundreds of employees. AI Series B milestones include achieving production-grade reliability (uptime SLAs, compliance certifications for regulated industries), reducing inference costs per user through model optimization or hardware upgrades, and building a data flywheel where usage improves the model, which attracts more users. Many AI startups at Series B hire dedicated MLOps teams to manage deployment pipelines, version control for models, and monitoring dashboards that catch drift or performance drops before customers notice.
Series C and beyond fund aggressive expansion, international growth, and the push toward profitability or exit. Rounds start at $30 million and can exceed $150 million, dilution drops to 10–20 percent because the company is more mature and has negotiating power, and valuations often reach $150 million to over $1 billion. Late-stage venture firms, growth equity funds, and private equity investors participate, expecting a clear path to sustained profit or a credible IPO timeline. Key milestones include global market presence, strategic partnerships with major enterprises or platform providers, and financial metrics showing operating leverage (revenue grows faster than headcount and infrastructure costs). For AI companies, Series C priorities include expanding the model to new domains or languages, reducing compute costs through custom silicon or algorithmic improvements, and proving the AI competitive moat is defensible through proprietary data, unique architecture, or network effects that make the model better with scale.
Cumulative Dilution, Cap Table, and Investor Type Infographics
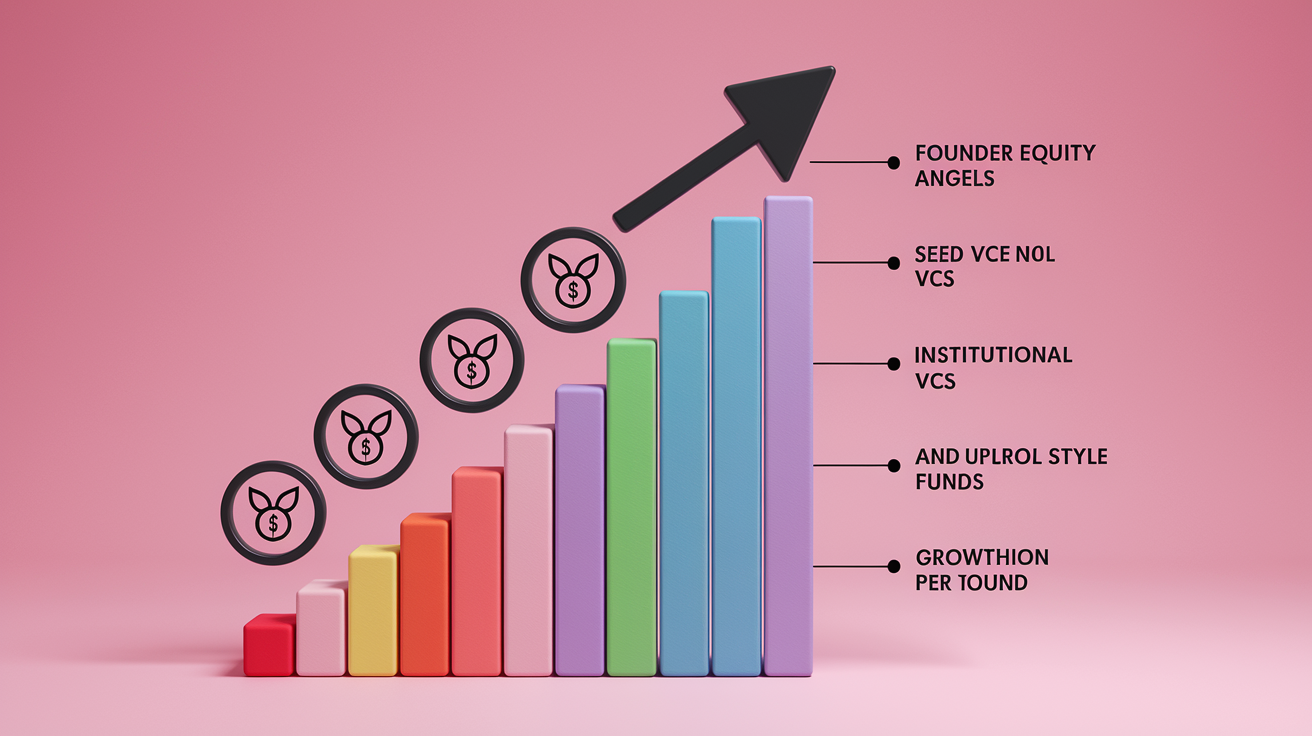
Dilution stacks up across every round. By Series C, founders usually own 40–60 percent of the company, down from 100 percent at inception. Each funding round dilutes all existing shareholders unless they participate in the new round to maintain their percentage. A simple cumulative dilution infographic shows a stacked bar chart with founder equity shrinking stage by stage while investor slices grow. Founders might hold 85–95 percent after Pre-Seed, 70–85 percent after Seed, 55–70 percent after Series A, 40–55 percent after Series B, and 30–50 percent after Series C, depending on deal terms and whether founders sold secondary shares. Dilution per round varies. Early rounds can be founder-friendly at 5–10 percent, but raising a large Seed or Series A at a lower valuation can push dilution to 25 percent or more in one shot. The infographic should note that dilution percentages assume no secondary sales, no option pool expansions, and no down rounds. Real cap tables are messier and include employee stock option pools that cut founder ownership further.
Investor types evolve predictably:
- Pre-Seed: individual angels, startup accelerators, and pre-seed micro-funds writing $25K–$250K checks.
- Seed: angel syndicates and dedicated seed VCs leading $500K–$2 million rounds.
- Series A: institutional venture firms specializing in early-stage companies, leading $5 million–$15 million rounds.
- Series B: growth VCs and corporate venture arms investing $10 million–$30 million per deal, expecting rapid revenue scaling.
- Series C and beyond: late-stage venture firms, growth equity funds, private equity investors, and strategic corporate investors writing $30 million–$100 million+ checks, prioritizing profitability and exit readiness.
A good infographic maps investor types onto the timeline, showing how the cap table shifts from a handful of angels and founders to a complex structure with multiple VC firms, employee option pools, and possibly strategic corporate investors. Including investor logos or icons (a single person icon for angels, a briefcase icon for VC firms, a globe icon for growth equity) makes it easier to scan and reinforces the idea that different stages attract different kinds of capital with different expectations.
AI-Specific Funding Considerations for Infographic Accuracy

AI startups face costs traditional software companies don’t, and those costs should appear front and center in any funding infographic claiming to be AI-specific. Model training expenses range from low thousands for small proof-of-concept experiments to over a million for large-scale foundation models or custom architectures trained on proprietary datasets. A single training run on a cluster of high-end GPUs can cost tens of thousands, and most production AI companies run dozens or hundreds of experiments before settling on a model configuration. Early-stage AI teams often underestimate training costs because cloud pricing calculators don’t account for failed runs, hyperparameter tuning, or the need to retrain models as data distributions shift. An accurate infographic includes a cost line item for “model development and training” at each stage, showing how budgets grow from $10K–$50K at Pre-Seed to $100K–$500K at Seed and $500K–$2 million+ at Series A and beyond.
Operational compute costs scale with user volume and model complexity. Running inference (generating predictions for users) on GPU infrastructure can cost $10K–$100K per month depending on query volume, model size, and latency requirements. Companies serving millions of requests per day often see compute bills in the six figures monthly, putting pressure on unit economics and forcing teams to optimize aggressively through model distillation, quantization, or moving to custom AI chips. These ongoing costs mean AI startups need larger raises or longer runways than SaaS peers at the same revenue level. An infographic should show this by including a “monthly burn rate” or “operational compute budget” metric per stage, so founders can see that hitting $1 million in ARR doesn’t automatically mean profitability if inference costs eat 30–50 percent of revenue.
Talent costs hit AI companies harder because machine learning engineers, research scientists, and data engineers command premium salaries. Total comp for senior ML talent ranges from $150K to over $400K per year depending on geography and seniority, and many AI startups compete directly with big tech and well-funded labs for the same candidates. A 10-person AI team might carry a payroll 50–100 percent higher than a 10-person traditional software team. Data acquisition and labeling add another layer of expense. Building a high-quality labeled dataset can cost tens of thousands to over a million dollars depending on domain complexity and labeling volume. An infographic panel titled “AI-Specific Costs” should break these out separately (training, compute, talent, data) and show how they inflate fundraising targets at each stage, helping both founders and investors calibrate realistic expectations and avoid undercapitalizing an AI startup.
Alternative Funding Streams and Non-Dilutive Infographic Panels

Not every dollar an AI startup raises has to come from venture capital. Bootstrapping (funding the company with founder savings, consulting revenue, or early customer payments) keeps equity dilution at zero and gives founders full control, though it limits growth speed and requires the business to be cash-flow positive quickly. Founders who bootstrap through Pre-Seed and early Seed can retain 80–90 percent ownership when they eventually raise institutional capital, but they give up the velocity and network that come with experienced investors.
Alternative funding options include:
- Grants from government agencies, research institutions, or non-profit accelerators, typically awarding $10K–$500K with no equity dilution and few strings beyond reporting requirements.
- Revenue-based financing, where investors advance $50K–$5 million in exchange for a percentage of monthly revenue until a repayment cap is reached (often 1.3x–2x the original amount), preserving equity but raising the effective cost of capital.
- Crowdfunding platforms (Kickstarter, Indiegogo) for hardware or consumer AI products, raising $50K–$2 million from thousands of small backers in exchange for early product access or rewards, though equity crowdfunding variants also exist.
- Strategic partnerships or pilot contracts with large enterprises, where the customer pre-pays for development work or commits to a minimum contract value that funds the next 6–12 months of runway.
Most AI startup funding infographics include a small sidebar or bottom panel labeled “Non-Dilutive Options” to show these paths visually. The panel should list typical amounts, pros (no dilution, flexible terms), and cons (slower growth, revenue dependence, limited strategic support). For AI companies specifically, grants can be valuable because many governments and research bodies fund machine learning R&D, offering $50K–$500K awards that help cover early training costs without giving up equity.
Designing an AI Startup Funding Stages Infographic

A well-designed funding infographic uses stage-specific colors to help readers instantly identify where a company sits on the timeline. Pre-Seed might appear in light blue, Seed in green, Series A in orange, Series B in purple, and Series C in red, with each stage panel using the same color for its background, border, or accent bar. Icons reinforce investor types (an angel icon for Pre-Seed, a briefcase for seed VCs, a building for institutional VCs, and a globe for late-stage growth funds), making it easy to scan the visual and understand who invests when. A horizontal timeline bar at the top or bottom shows months or years per stage, giving context to the fundraising journey (“6–12 months” under Pre-Seed, “12–18 months” under Seed). All text should use high-contrast colors (dark text on light backgrounds or vice versa) to meet accessibility standards, and font sizes should be large enough to read on mobile screens, since many people will see the infographic on a phone.
Export formats matter for sharing and embedding. The infographic should export cleanly as a high-resolution PNG for social media, an SVG for web embedding and infinite scaling, and a PDF for printing or investor decks. Each format should preserve colors, fonts, and alignment, and the file size should stay under 2–3 MB to load quickly. The design should include a small footer or side note saying “Customize these ranges with your actual data” to remind users that the numbers are illustrative and should be replaced with real fundraising amounts, valuations, and milestones when creating a company-specific version.
| Visual Element | Purpose | Best Practice |
|---|---|---|
| Stage-specific color coding | Instant recognition of funding stage | Use 5–6 distinct colors; keep palette consistent across all panels |
| Investor-type icons | Show who invests at each stage | Simple, recognizable icons (person, briefcase, building, globe); label each icon |
| Timeline bar | Communicate duration per stage | Show months or years under each stage; use a thin horizontal line with markers |
Case Study Examples for AI Startup Funding Visuals

Including real or placeholder case studies in a funding infographic helps viewers connect abstract numbers to concrete outcomes. A side panel or bottom section titled “Example AI Startup Journey” can show a simplified trajectory: Company X raised $500K Seed in Month 12, $8M Series A in Month 30, $30M Series B in Month 54, and reached a $400M valuation at IPO in Year 7. These examples ground the ranges and timelines in reality and show that while the median path might take 5–10 years from founding to public offering, individual companies can move faster or slower depending on market conditions, product complexity, and execution. For AI startups, case studies should include a note about AI milestones (“Achieved 95 percent model accuracy at Seed” or “Scaled to 10 million inference requests per day by Series B”) to show how technical progress aligns with fundraising stages.
Suggested use cases for including example trajectories:
- Highlighting successful exits (IPO or acquisition) to show what late-stage valuations look like and how long the journey usually takes.
- Comparing fast-growth paths (18 months from Seed to Series B) versus steady-growth paths (36 months between rounds) to set realistic expectations.
- Demonstrating how AI costs (training, compute, talent) push some startups to raise larger rounds or extend timelines compared to traditional SaaS companies at similar revenue levels.
Final Words
In the action, this piece laid out a clear roadmap: a visual overview, pre-seed to Series C breakdowns, cumulative dilution and cap table visuals, AI-specific cost effects, alternative funding panels, design tips, and case study examples.
Use the checklist and sample metrics to build a clean, color-coded timeline you can tweak for your numbers. Highlight compute and talent costs so timelines stay realistic.
A sharp ai startup funding stages infographic makes fundraising conversations faster and clearer, and it helps you tell the story investors actually care about.
FAQ
Q: What does an AI startup funding stages infographic show?
A: An AI startup funding stages infographic shows the funding path from Pre-Seed to IPO, with per-stage funding, valuations, investor types, dilution, and key milestones like MVP, PMF, and scaling.
Q: How do I read the funding amounts, valuations, and milestones on the infographic?
A: You read funding amounts as recommended check sizes, valuations as typical ranges, and milestones as stage goals — use the timeline order and color blocks to match amounts with milestones and investor types.
Q: What are typical funding ranges and valuations for each stage?
A: Typical ranges are Pre-Seed $50K–$1M (valuation $1M–$6M), Seed $500K–$5M ($3M–$15M), Series A $3M–$15M ($15M–$50M), Series B $10M–$50M ($50M–$200M), Series C $30M–$150M+ ($150M–$1B+).
Q: How much dilution should founders expect per round and overall?
A: Founders should expect per-round dilution around 5–25% and typical cumulative founder dilution of about 40–60% across multiple rounds, shown as stacked ownership bars in the infographic.
Q: Which investor types back startups at each stage?
A: Early stages use angels and accelerators, Seed brings seed VCs, Series A attracts institutional VCs, Series B sees growth VCs, and later rounds may involve private equity or strategic corporate investors.
Q: What AI-specific costs should the infographic include and why do they matter?
A: Include model training ($10Ks–$1M+), compute ($10Ks–$100Ks/month), ML talent ($150K–$400K+), and data acquisition ($10Ks–$1M+); they raise capital needs and can extend fundraising timelines and milestones.
Q: How do I visualize cumulative dilution and a cap table in one graphic?
A: Visualize cumulative dilution with stacked founder vs investor percentage bars, a simple cap table snapshot for pre/post rounds, and an example showing how founder ownership shrinks over rounds.
Q: What non-dilutive funding sources should I show as infographic side panels?
A: Show bootstrapping ($0–$500K), grants ($10K–$500K), revenue-based financing ($50K–$5M), and government or research awards as sidebar blocks with typical amounts and use cases.
Q: What design elements and export formats work best for these infographics?
A: Use stage-specific colors, clear icons, horizontal timeline bars, accessible contrast, and export-ready PNG, SVG, and PDF formats so teams can reuse and print the graphic.
Q: How should I customize the infographic to reflect my startup’s situation?
A: Customize the infographic by updating funding amounts, milestone criteria, cost estimates, timelines, and currency, and by adding notes that state assumptions and data sources for accuracy.
Q: What are realistic timeline and exit expectations for AI startups?
A: Realistic timelines put IPO or major exit at about 5–10+ years, with late-stage valuations often between $300M and $1B+ depending on market fit, scale, and revenue traction.