


Is fast growth hiding a money problem for your SaaS?
Chasing users without checking unit economics can eat cash even when revenue climbs.
Founders, CFOs, and growth teams need clear signals: CAC, LTV, LTV:CAC, CAC payback, and gross margin.
This post shows how to calculate each metric, read what the numbers mean for scaling, and spot the common traps that make growth look healthier than it is.
Read on for a step-by-step framework, real examples, and quick checks you can run this week to protect margin as you grow.
Core Metrics for Evaluating SaaS Financial Viability

Strong unit economics separate sustainable SaaS businesses from companies burning cash on vanity metrics. Every dollar spent acquiring a customer has to eventually return more than a dollar in profit. The primary metrics that reveal whether that equation holds are Customer Acquisition Cost (CAC), Lifetime Value (LTV), the LTV:CAC ratio, CAC payback period, and gross margin.
Together, these tell you if your business model can scale profitably or if growth just deepens losses.
CAC measures the total sales and marketing expense required to land one new customer. The formula is straightforward: divide all sales and marketing costs in a given period by the number of new customers acquired in that same period. If you spend $50,000 on sales and marketing in a quarter and sign 100 new customers, your CAC is $500.
LTV estimates the total gross profit a customer will generate over their entire relationship with your product. The standard formula is LTV = (ARPU × Gross Margin %) ÷ Monthly Churn Rate, where ARPU is average revenue per user per month. If a customer pays $100 per month, your gross margin is 80%, and monthly churn is 2%, then LTV = (100 × 0.80) ÷ 0.02 = $4,000.
The LTV:CAC ratio shows how many dollars of customer lifetime value you capture for every dollar spent on acquisition. A ratio of 3:1 or higher is considered healthy for most SaaS companies. It means you earn three dollars back for every dollar invested.
Ratios below 3 suggest you’re spending too much to acquire customers or not retaining them long enough. Ratios above 5 may indicate you’re under investing in growth.
CAC payback period measures how many months it takes to recover acquisition costs from gross profit. The formula is CAC ÷ (ARPU × Gross Margin %). Using the earlier example, $500 CAC ÷ ($100 × 0.80) = 6.25 months. Payback under 12 months is strong. Anything over 18 months usually signals a need to improve pricing, reduce churn, or cut acquisition costs.
SaaS gross margin (revenue minus the direct cost of delivering the service) typically ranges from 70% to 90%. High gross margin is non negotiable for strong unit economics because every percentage point of margin multiplies into LTV. A product with 90% gross margin can support much higher CAC or tolerate higher churn than one with 70% margin. Low gross margin often points to inefficient infrastructure, manual delivery processes, or unsustainable pricing that will collapse under scale.
The five essential metrics are:
- CAC (Customer Acquisition Cost) – total sales and marketing spend per new customer acquired.
- LTV (Lifetime Value) – total gross profit expected from a customer over their entire lifespan.
- LTV:CAC ratio – efficiency of acquisition spending; target 3:1 or better.
- CAC payback period – months required to recover acquisition cost from gross profit; aim for under 12 months.
- Gross margin (%) – percentage of revenue left after direct costs; SaaS companies should target 70–90%.
Step by Step Framework for Calculating SaaS Unit Economics

Before running any formulas, gather clean data from three sources: your income statement (for revenue, COGS, and sales/marketing expenses), your customer database (for counts of new customers, active customers, and churned customers), and your billing system (for ARPU and monthly recurring revenue).
Verify that all figures use the same time window. Mixing quarterly marketing spend with monthly customer counts will skew CAC. Ensure your churn rate reflects the same cohort period as your revenue and cost data.
Start by calculating ARPU: total monthly recurring revenue divided by the number of active paying customers. If you have $50,000 in MRR and 500 customers, ARPU is $100.
Next, compute gross margin as (Revenue − COGS) ÷ Revenue. If monthly revenue is $50,000 and direct costs (hosting, support, transaction fees) total $10,000, gross margin is 80%.
Then calculate monthly churn rate: the number of customers who cancelled in the month divided by the number of customers at the start of the month. If you began with 500 customers and lost 10, monthly churn is 2%.
With those inputs ready, follow this sequence:
- Calculate CAC = (Total sales expense + Total marketing expense) ÷ Number of new customers acquired in the same period.
- Calculate LTV = (ARPU × Gross Margin %) ÷ Monthly Churn Rate.
- Calculate LTV:CAC ratio = LTV ÷ CAC.
- Calculate CAC payback period (months) = CAC ÷ (ARPU × Gross Margin %).
- Check that gross margin percentage is above 70%; if not, investigate infrastructure or delivery costs.
- Review all calculations against prior periods to spot trends. Sudden spikes in CAC or churn often signal problems before they appear in revenue reports.
Worked Examples Using Realistic SaaS Scenarios

Real numbers make the formulas concrete.
Assume you run a mid market project management SaaS with 400 active customers, $80,000 in monthly recurring revenue, and $16,000 in monthly COGS (hosting, support, and third party API costs). Last quarter you spent $60,000 on sales and marketing and signed 120 new customers. Eight customers churned last month.
Example Calculation Walkthrough
ARPU = $80,000 MRR ÷ 400 customers = $200 per month.
Gross margin = ($80,000 − $16,000) ÷ $80,000 = 80%.
Monthly churn rate = 8 churned ÷ 400 starting customers = 2%.
CAC = $60,000 ÷ 120 new customers = $500.
LTV = ($200 × 0.80) ÷ 0.02 = $8,000.
LTV:CAC ratio = $8,000 ÷ $500 = 16:1.
CAC payback = $500 ÷ ($200 × 0.80) = 3.125 months.
The table below summarizes the full picture.
| Metric | Value | Interpretation |
|---|---|---|
| ARPU | $200/month | Average revenue per customer |
| Gross Margin | 80% | Healthy for SaaS; leaves room for sales and overhead |
| CAC | $500 | Moderate acquisition cost |
| LTV | $8,000 | Strong retention creates high lifetime value |
| LTV:CAC | 16:1 | Excellent efficiency; may indicate under investment in growth |
| CAC Payback | 3.1 months | Very fast; cash recovers quickly to fund more growth |
An LTV:CAC of 16 and payback under four months suggest this company can afford to spend significantly more on acquisition while remaining profitable. It’s likely leaving growth on the table by being too cautious with sales and marketing budgets.
Industry Benchmarks and How to Interpret Them

Benchmarks vary by customer segment and contract size.
B2B SaaS serving small businesses typically sees monthly churn between 3% and 7%, CAC from $200 to $1,000, and LTV:CAC ratios around 3 to 5. Mid market SaaS (annual contracts $10,000 to $100,000) often achieves monthly churn below 2%, CAC between $1,000 and $5,000, and LTV:CAC ratios of 5 to 8.
Enterprise SaaS can have CAC above $10,000 but annual churn under 10% and LTV:CAC ratios exceeding 7 because multi year contracts and high switching costs drive long customer lifespans.
Payback expectations also shift by segment. SMB SaaS companies usually need payback under 12 months because short customer lifespans and higher churn make longer payback periods risky. Enterprise products can tolerate 18 to 24 months of payback if gross margin is high and contracts are multi year, but anything beyond 24 months requires either venture funding or a plan to accelerate revenue per customer.
Gross margin benchmarks are more consistent: pure software SaaS should exceed 75%, while products with significant service components (onboarding, managed services, or high touch support) may run between 65% and 75%. Anything below 65% suggests structural cost problems that will limit profitability even if acquisition and retention metrics look strong.
Use these ranges to calibrate your own performance:
- SMB SaaS: LTV:CAC 3–5, CAC payback under 12 months, monthly churn 3–7%.
- Mid market SaaS: LTV:CAC 5–8, CAC payback 10–16 months, monthly churn 1–3%.
- Enterprise SaaS: LTV:CAC 6–10+, CAC payback 12–24 months, annual churn under 10%.
- All segments: gross margin above 70%; anything below 65% is a red flag.
Common Pitfalls That Lead to Misleading Unit Economics

The most frequent mistake is ignoring gross margin when calculating LTV. Using revenue instead of gross profit inflates LTV and hides unsustainable infrastructure costs. A $10,000 LTV based on revenue may shrink to $7,000 when you account for the 30% of revenue consumed by hosting and support, and that difference changes every downstream decision about how much you can spend on acquisition.
Misclassifying expenses distorts CAC. Sales salaries, commissions, marketing software, advertising spend, and account based marketing campaigns all belong in CAC, but many companies exclude onboarding costs or customer success salaries even when those teams directly influence conversion. Conversely, including product development or general overhead in CAC artificially raises the number and makes growth look less efficient than it is.
Five common pitfalls to watch for:
- Using account churn instead of dollar churn when customers pay different amounts. Losing a $50/month customer is not the same as losing a $500/month customer.
- Failing to separate new customer CAC from expansion revenue. Upsells and cross sells to existing customers incur almost no acquisition cost and should be tracked separately.
- Calculating churn over inconsistent time windows. Mixing monthly churn with quarterly CAC creates misleading LTV:CAC ratios.
- Ignoring cohort behavior. Averaging churn across all customers hides the fact that customers acquired in different periods or channels may have wildly different retention profiles.
- Assuming costs will scale down automatically. Cloud infrastructure and support costs often have fixed minimums that persist even when customer counts drop.
Decision Making Framework: How to Use Unit Economics to Guide Strategy
Unit economics convert financial data into action.
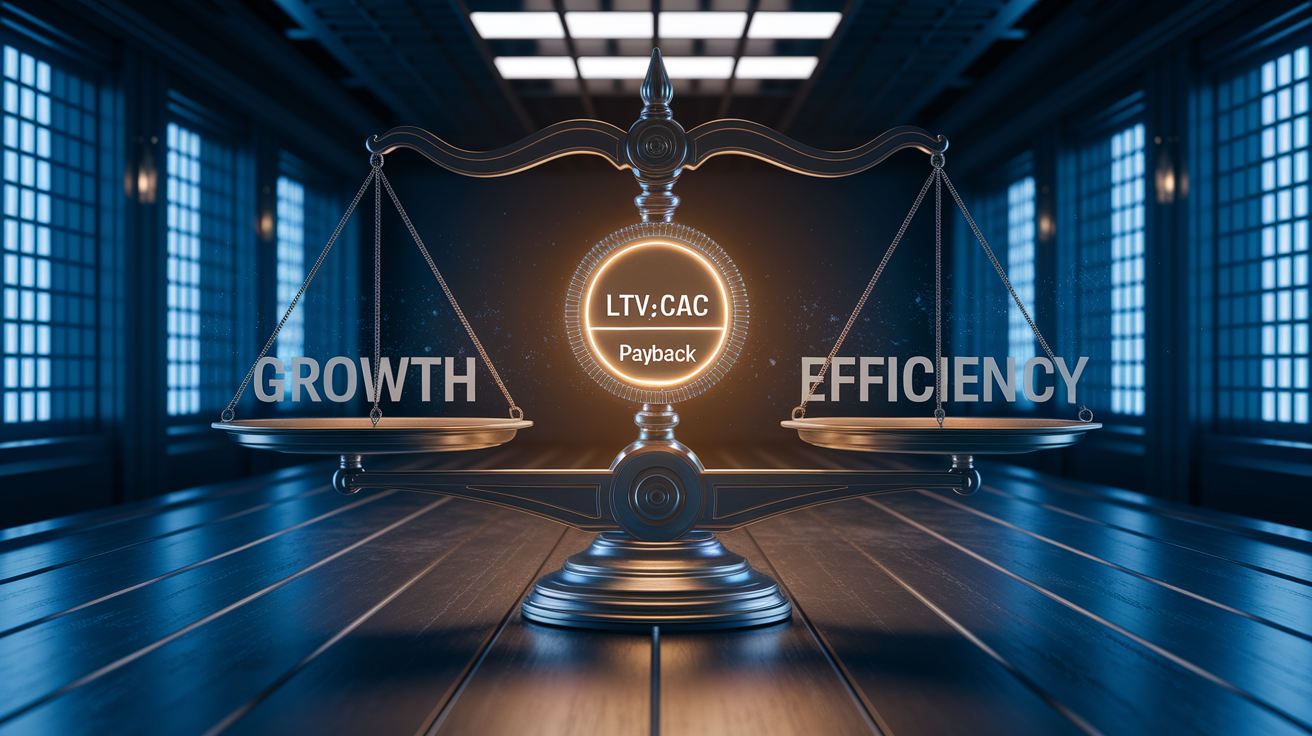
When LTV:CAC is above 5 and payback is under 10 months, the business can invest aggressively in sales and marketing because each dollar returns quickly and multiplies into long term profit. When LTV:CAC falls below 3 or payback stretches beyond 18 months, the priority shifts to fixing the business model (raising prices, reducing churn, cutting acquisition costs, or improving gross margin) before scaling customer volume.
If CAC is rising, diagnose whether the issue is higher ad costs, longer sales cycles, or lower conversion rates, then decide whether to optimize the funnel, refine targeting, or adopt product led growth tactics to reduce human touch sales.
If LTV is falling, investigate whether churn is accelerating, expansion revenue is shrinking, or pricing is failing to capture value. Often a small pricing adjustment or a customer success intervention will stabilize LTV faster than doubling down on acquisition.
If gross margin is compressing, audit cloud spend, review vendor contracts, and consider re architecting expensive features. One company reduced a feature’s cost by 80% through smarter infrastructure design and saved over $3 million annually.
Strategic resource allocation depends on where you sit on the efficiency curve. Companies with strong unit economics but slow growth should increase marketing spend and expand sales capacity. Companies with weak unit economics but fast growth should pause new customer acquisition, focus on retention and upsells, and optimize pricing before the burn rate becomes unsustainable.
The decision matrix is simple: fix the model first, then scale.
Growth vs Efficiency Signals
LTV:CAC below 2 means every new customer destroys value. Stop spending on acquisition and fix pricing, churn, or CAC before adding more customers.
LTV:CAC between 2 and 3 is neutral territory. Focus on improving one or two levers (raise ARPU, cut CAC, reduce churn) before scaling.
LTV:CAC above 3 with payback under 12 months is the green light to grow. Invest in marketing, hire sales reps, and expand into new segments.
LTV:CAC above 5 with payback under 8 months often signals under investment. You’re leaving money on the table by not spending more to acquire customers who will pay back quickly and generate years of profit.
CAC payback beyond 18 months, regardless of LTV:CAC ratio, should trigger caution. Long payback periods strain cash flow and increase the risk that customers churn before you recover acquisition costs.
Final Words
You learned the core metrics—CAC, LTV, LTV:CAC, payback period, and gross margin—and how they slot into a simple calculation flow.
We walked through the step‑by‑step formulas, worked examples, benchmarks, common pitfalls, and a decision framework for growth versus efficiency.
Use the checklists and examples to run your own numbers. This is a practical guide for how to analyze SaaS unit economics, spot weak spots, and make faster, evidence‑based choices.
Do this regularly and you’ll steer toward more sustainable growth.
FAQ
Q: What are the core metrics for evaluating SaaS financial viability?
A: The core metrics for evaluating SaaS financial viability are CAC, LTV, LTV:CAC, CAC payback period, and gross margin, which show acquisition cost, customer value, profitability, and sustainability.
Q: How do you calculate CAC and which costs should be included?
A: The CAC calculation is total sales and marketing spend divided by new customers; include ad spend, sales salaries, commissions, and related overhead for an accurate cost-per-acquisition.
Q: How do you calculate LTV and what formula should I use?
A: LTV is calculated as ARPU times gross margin divided by churn rate; this estimates the revenue a customer brings over their lifetime after accounting for contribution margin.
Q: What does the LTV:CAC ratio mean and what is a healthy benchmark?
A: The LTV:CAC ratio compares customer value to acquisition cost; a healthy benchmark is about 3:1, meaning customers are worth roughly three times their acquisition cost.
Q: What is the CAC payback period and what target should I aim for?
A: The CAC payback period measures months to recover CAC from gross margin; under 12 months is strong for most SaaS, while over 18 months suggests you should slow acquisition.
Q: What gross margin should SaaS companies expect and why does it matter?
A: SaaS gross margins typically run 70-90%; high gross margin matters because it funds customer success, product, and growth while improving LTV and payback outcomes.
Q: What step-by-step process should I follow to calculate unit economics?
A: To calculate unit economics, prepare consistent time-frame revenue and spend data, verify new customer counts, then compute CAC, LTV, LTV:CAC, and CAC payback in that order.
Q: What are realistic CAC, churn, and LTV examples for SaaS?
A: Typical startup CAC ranges $200-$1,500; churn varies by segment; mature SaaS often targets LTV about 3-7x CAC to justify acquisition and show sustainable unit economics.
Q: How do benchmark ranges differ across SMB, mid-market, and enterprise SaaS?
A: SMB SaaS usually has lower CAC, higher churn, and shorter payback; mid-market balances cost and retention; enterprise shows higher CAC but longer LTV and payback windows.
Q: What common mistakes lead to misleading unit economics?
A: Common pitfalls include mixing expansion and new-sales revenue, excluding retention costs, misclassifying marketing spend, using inconsistent time frames, and ignoring churn drivers.
Q: How should unit economics guide strategic decisions on growth versus efficiency?
A: Use unit economics to decide: if LTV:CAC <2 focus on efficiency; LTV:CAC ≥3 allows growth spend; CAC payback over 18 months suggests pausing aggressive acquisition.