

That “80% in 30 minutes” promise is a lab stunt, not your daily reality.
Manufacturers test with a cool battery, a certified cable, a top charger, and nothing running—conditions most of us never recreate.
In real life, room heat, worn cables, background apps, and battery age shave off 10–40% or more from headline speeds.
This post explains how launch claims translate into everyday charging, why the peak power window is so short, and the simple checks that actually get you closer to the numbers.
Real-World Charging Behavior Compared to Launch Claims
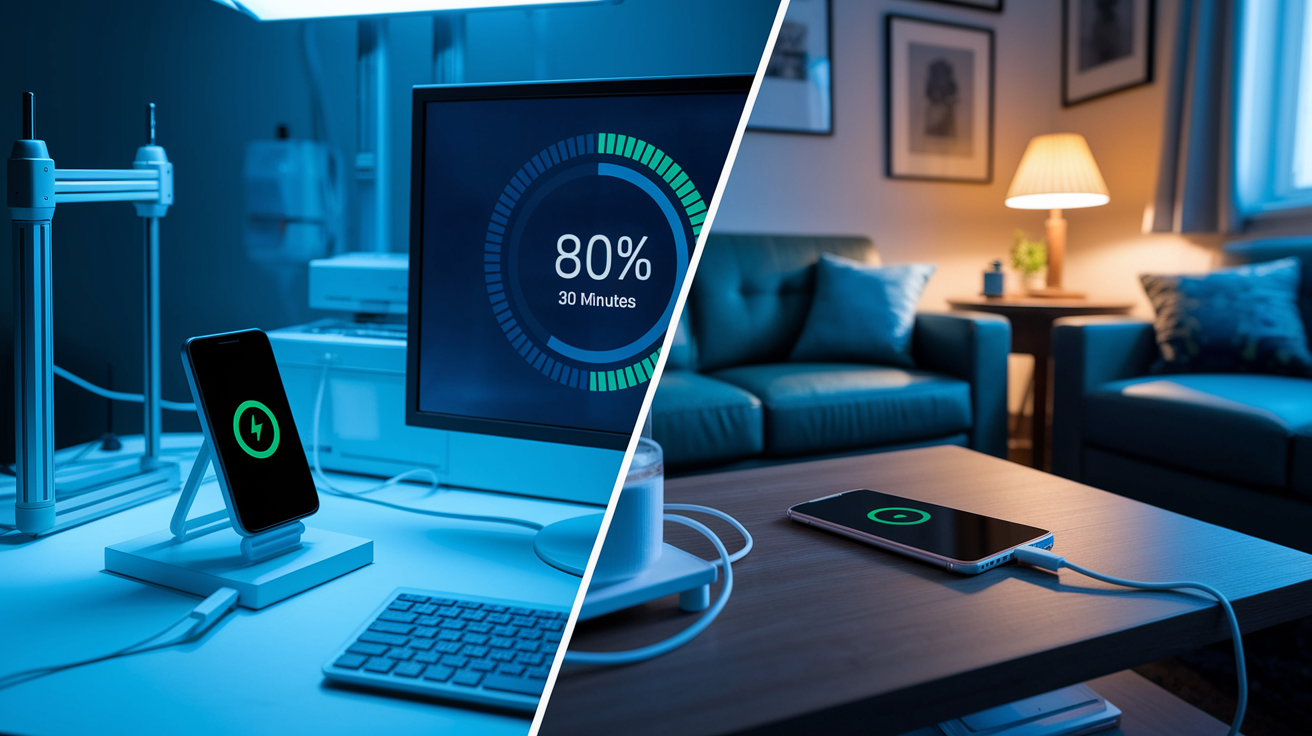
When you see “80% in 30 minutes” on a spec sheet, that’s the best possible outcome under conditions you’ll almost never recreate at home. The manufacturer tested with a battery sitting at the perfect 20–25°C, starting from nearly empty (usually under 10%), using a flawless certified cable, a high-wattage charger dialed in exactly right, and absolutely nothing running on the device. Zero background apps. Screen off. No notifications pinging.
That’s not how anyone actually charges their phone.
Most of us plug in with the screen lit up, apps pulling data in the background, room temperature doing whatever it wants, and a cable we grabbed because it was nearby. Maybe it came with an old tablet. Maybe it’s been twisted into a permanent pretzel shape under the couch. The charger? Could be from three phones ago. And we’re definitely scrolling while it charges.
So real-world times land 10–40% slower than the headline number. Sometimes more.
The gap gets worse because that peak power delivery everyone brags about lasts maybe 10–20 minutes. After that opening sprint, thermal sensors and the battery management chip start pulling back to protect the cells and keep things from overheating. If the room’s warm (above roughly 35°C), charging can slow down hard even in those early minutes. Running anything heavy like navigation, a game, or video? You’re losing 10–30% or more of the incoming power right there, diverted to keep the phone running instead of filling the battery.
And here’s the trick: that “80% in X minutes” claim highlights the easiest part of the curve. Devices crawl once you pass about 70–80% charge, entering a protective taper that can double or triple the time needed to reach 100%. Marketing talks up the steep climb and goes quiet about the long, slow finish. It makes the whole session sound fast when the actual behavior is anything but uniform.
| Claim | Typical Real-World Result | Reason for Gap |
|---|---|---|
| 50% in 15 minutes | 40–45% in 15 minutes | Screen-on usage, ambient heat, cable resistance |
| 80% in 30 minutes | 70–75% in 30 minutes | Thermal throttling after first 10–15 minutes of peak power |
| Peak 65W sustained | Peak 65W for ~10 min, then 40–50W | Battery management IC limits current as internal resistance and temperature rise |
| 80–100% in “under an hour” | 80–100% in 45–90 minutes | Severe taper above 80% SOC to protect cell chemistry |
Charging Curve Behavior and Power Taper in Daily Use
Fast charging doesn’t just go full speed until it’s done. It follows a curve shaped by chemistry and heat limits. Right at the start, the battery controller negotiates maximum voltage and current, ramping up fast if the battery’s cool and nearly empty. You’ll hit that headline wattage the manufacturer loves to shout about within maybe 5–10 minutes. But that peak is a short window. Most devices hold max power for only 10–20 minutes before internal resistance climbs and the cell heats up enough to force the controller to pull back. The steepest percent gains happen in this narrow slice, which makes the whole process feel faster than it actually is.
Once you cross about 50–60% charge, the curve flattens out. Voltage gets close to the cell’s upper limit, and the controller switches from pumping in constant current to holding constant voltage, slowly dialing down the amps to avoid damaging the lithium. By 70–80%, wattage might have dropped to half the peak or less. That final 20% can take as long as the first 50% because the trickle slows to a crawl. The system’s protecting longevity over speed. Older batteries or phones already warm from heavy use hit the taper even earlier, squeezing that high-speed window tighter and widening the gap between what was promised and what you actually see.
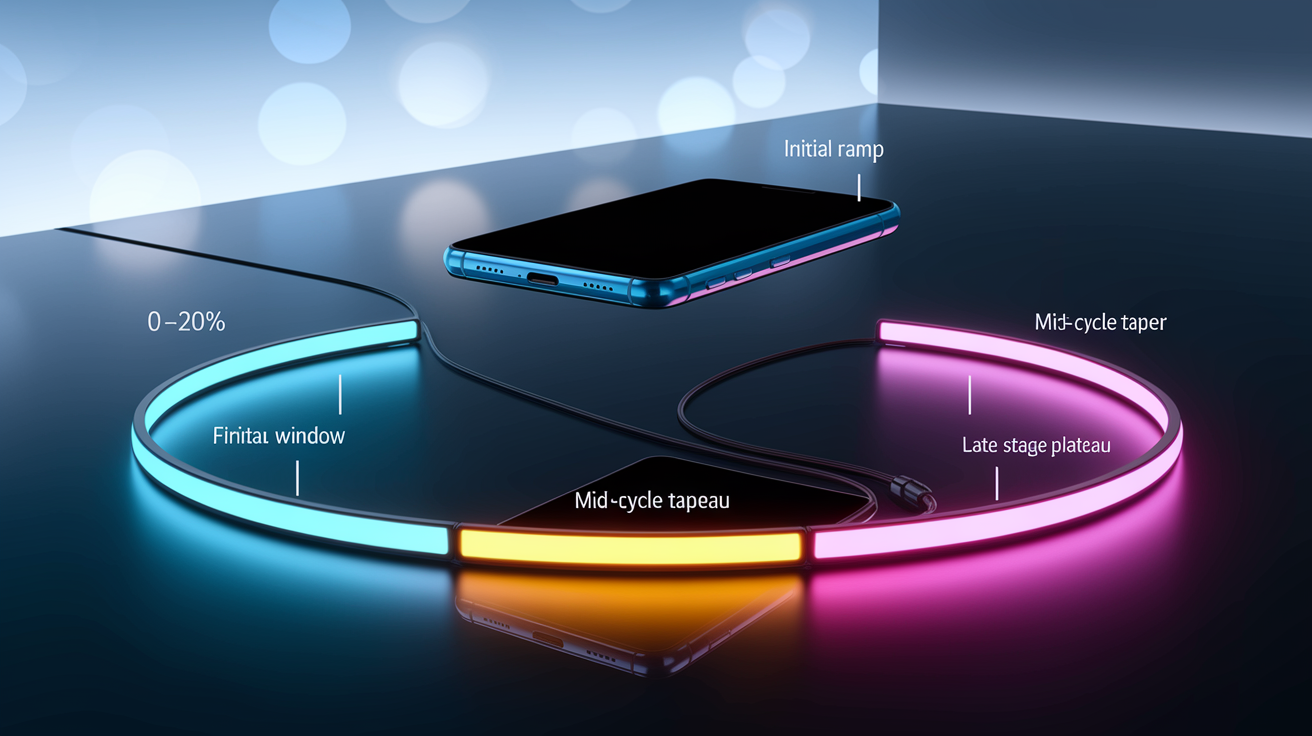
A typical session breaks into four chunks:
- Initial ramp (0–20%): voltage and current get negotiated fast. Power climbs to peak in 5–10 minutes if temperature and cable cooperate.
- Peak window (20–60%): sustained max wattage for roughly 10–20 minutes. This is where you get the steepest climbs per minute.
- Mid-cycle taper (60–80%): the battery management chip cuts current as voltage nears the cell limit. Wattage drops to maybe 40–60% of peak.
- Late-stage plateau (80–100%): constant voltage mode takes over. Current falls to 10–20% of peak. This stretch can equal or outlast the first three phases combined.
Real-World Factors That Reduce Fast Charging Speeds
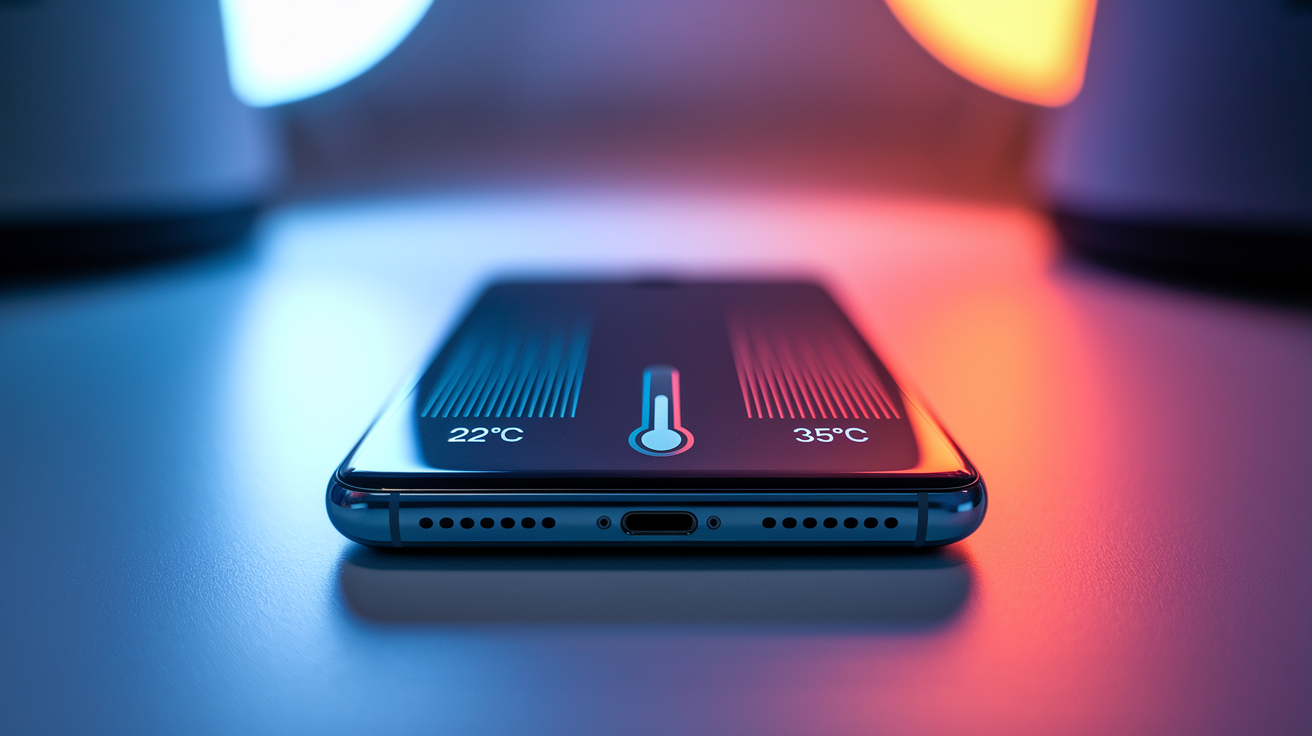
Temperature’s one of the biggest speed killers. Lithium-ion cells work best between about 20°C and 25°C. Go above 35°C and thermal sensors slam the brakes, cutting wattage by 30–50% or more even if the battery’s nearly empty. Cold temps below 10°C slow down ion movement inside the cell, dragging out the session just as badly. Charge your phone in direct sun, a hot car, or while running something intensive and you’re almost guaranteed to land well below the advertised claim because the battery never gets near those controlled lab conditions.
Background activity eats into net charging speed in a big way. Screen on, apps running, navigation or video streaming or a game in progress? The device pulls power from the charger to feed the processor, the graphics chip, the display. Heavy tasks can burn 10–30% or more of what’s coming in, leaving only the rest to actually fill the battery. A 65W charger putting 20W toward keeping things running leaves just 45W for storage. That headline claim vanishes instantly. Charging with the device off or in airplane mode gets rid of this drain and speeds things up, but almost nobody does that day to day.
Cable quality and charger compatibility throw up more roadblocks. Cables that don’t support Power Delivery lack the wiring and resistors needed to negotiate high voltage profiles, capping power at 5V and 3A (15W max) no matter how capable the charger is. Thin cables or long ones crank up resistance, turning watts into heat instead of stored energy. Plug a 20W brick into a device rated for 65W and the session maxes out at the charger’s limit, not the phone’s potential. Even certified cables wear out, developing higher resistance over time that cuts delivered power without any visible damage.
The main speed killers you’ll run into:
- Ambient temperature: throttling kicks in above roughly 35°C or below about 10°C.
- Cable quality: non-PD or high-resistance cables choke wattage and voltage negotiation.
- Charger wattage: underpowered bricks become the bottleneck. Extra capacity beyond the device limit won’t speed things up.
- Background load: screen-on use and active apps siphon off 10–30% or more of incoming power.
- Battery age and health: cells at 80–90% capacity taper earlier and accept lower peak power.
- State of charge window: speeds drop hard above 70–80% no matter what else you do.
Standardized Tests for Verifying Launch Claims in Real Life
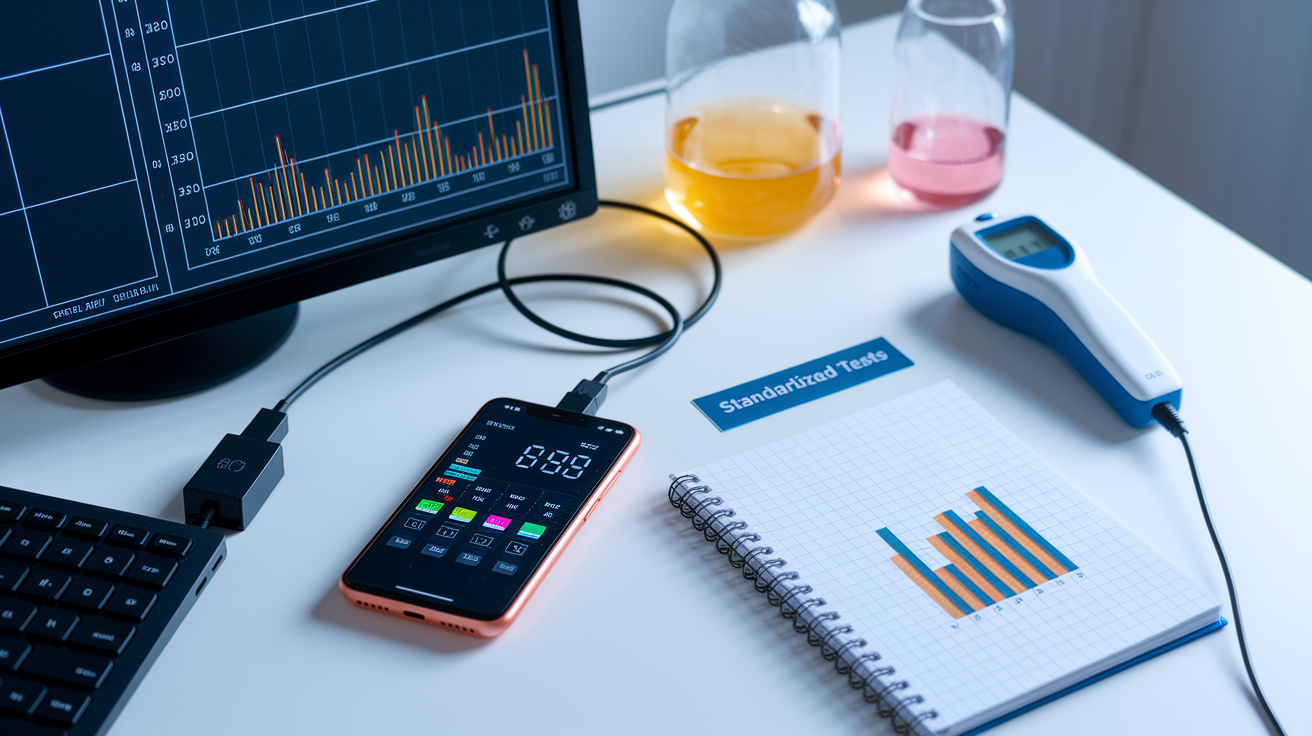
Getting results you can trust means controlling the same things manufacturers tweak in the lab. Ambient temperature needs to be measured and kept steady across runs. Testing at 20°C, 25°C, and 30°C shows how thermal behavior shifts speed. Start every test from 5–10% charge for consistency, because how a battery accepts power changes wildly across different charge levels. Use the same certified USB-C cable and charger model every time to knock out upstream variables. Disable background sync or flip on airplane mode to remove load swings. Without these controls, your numbers scatter everywhere and comparing them to advertised claims becomes pointless.
How often you log data determines how much detail you capture. Track state of charge and wattage every minute for the first 30 minutes to catch the peak window and initial taper. Switch to five-minute intervals after that to map the slow crawl to 100%. A USB-C power meter that records voltage, current, live wattage, and cumulative energy gives you the data to calculate real percent-per-minute rates and stack them against the marketing copy. A surface thermal probe tracking battery temperature shows when and why throttling happens, connecting wattage drops to heat limits instead of blaming the charger or cable.
Run at least three repeats per setup (same device, charger, cable, ambient temp, starting charge level) to get median and standard deviation values that account for normal session-to-session wobble. A single snapshot can lie if the device happened to be warm, the battery partially worn, or a background process briefly woke up. Repeat the baseline test at 0, 3, 6, 12, and 24 months to track how charging speed degrades as the battery racks up cycles and loses capacity. That separates launch-day best case from long-term everyday reality.
| Test Condition | Required Control | Measurement Interval |
|---|---|---|
| Ambient temperature | Hold at 20°C, 25°C, or 30°C; measure with external thermometer | Record once at start and end of session |
| Starting SOC | Discharge to 5–10% before each test run | Log at t=0 and every 1 minute for 30 min, then every 5 min |
| Cable and charger type | Use PD-certified cable and charger rated ≥ device max input | Note model/spec once; verify no changes across runs |
| Background load | Airplane mode or power-off for max-speed test; normal use for real-world test | Document mode at session start |
| Power logging cadence | USB-C meter recording V, A, W, cumulative Wh | Every 1 minute (0–30 min), every 5 minutes (30–100 min) |
Battery Age, Health, and Long-Term Charging Performance
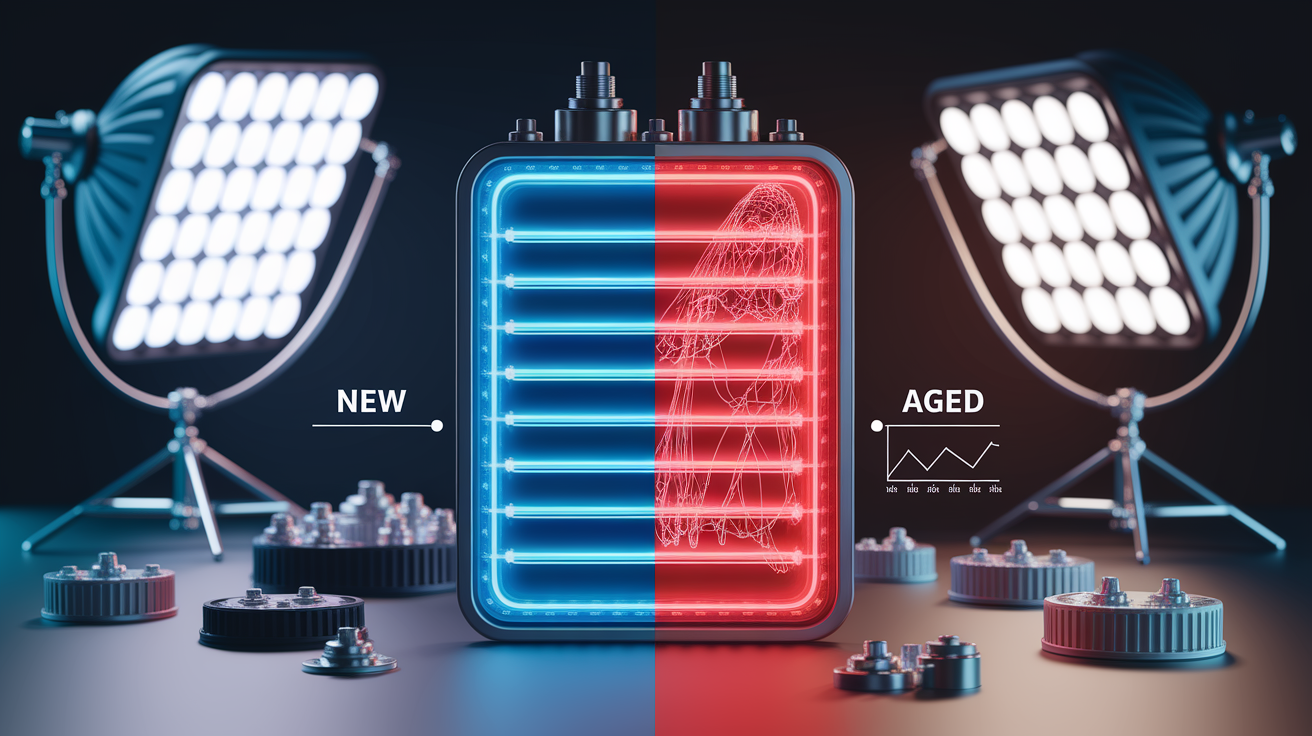
As batteries age and pile up charge cycles, internal resistance climbs and max capacity drops. The charging curve drifts away from launch-day behavior. A device with battery health at 85% can’t hit the same peak wattage it pulled when new because higher resistance turns more incoming power into heat, forcing the battery controller to throttle current earlier. The peak window shrinks, taper starts at lower charge levels, and the time to reach 50% or 80% stretches compared to fresh-cell benchmarks. Advertised speeds assume 100% health and minimal cycles. Those conditions evaporate within months of regular use.
Testing at 0, 3, 6, 12, and 24 months shows measurable slowdowns even when overall capacity stays above 90%. Devices that initially hit 50% in 15 minutes might need 18–20 minutes after a year of daily charging. The 80% mark can slip from 30 minutes to 40 minutes or longer as internal resistance creeps up. Thermal throttling kicks in sooner on aged batteries because degraded cells generate more heat under the same load, triggering protective current limits earlier in the session. These shifts are gradual but they stack up, widening the gap between marketing claims and everyday experience without any obvious hardware failure.
Main long-term hits to real-world charging speed:
- Lost peak wattage: max accepted power drops from advertised levels (say, 65W down to 50–55W) as internal resistance grows with cycle count.
- Earlier thermal throttling: aged cells run hotter under load, tripping temperature-based current limits sooner.
- Increased internal resistance: more energy lost as heat during charging, cutting net state-of-charge gain per minute.
- Slower mid-range charging: the 40–70% window, once the fastest stretch, drags out as the taper point creeps lower.
Charger, Cable, and Power Source Influence on Practical Charging Speeds
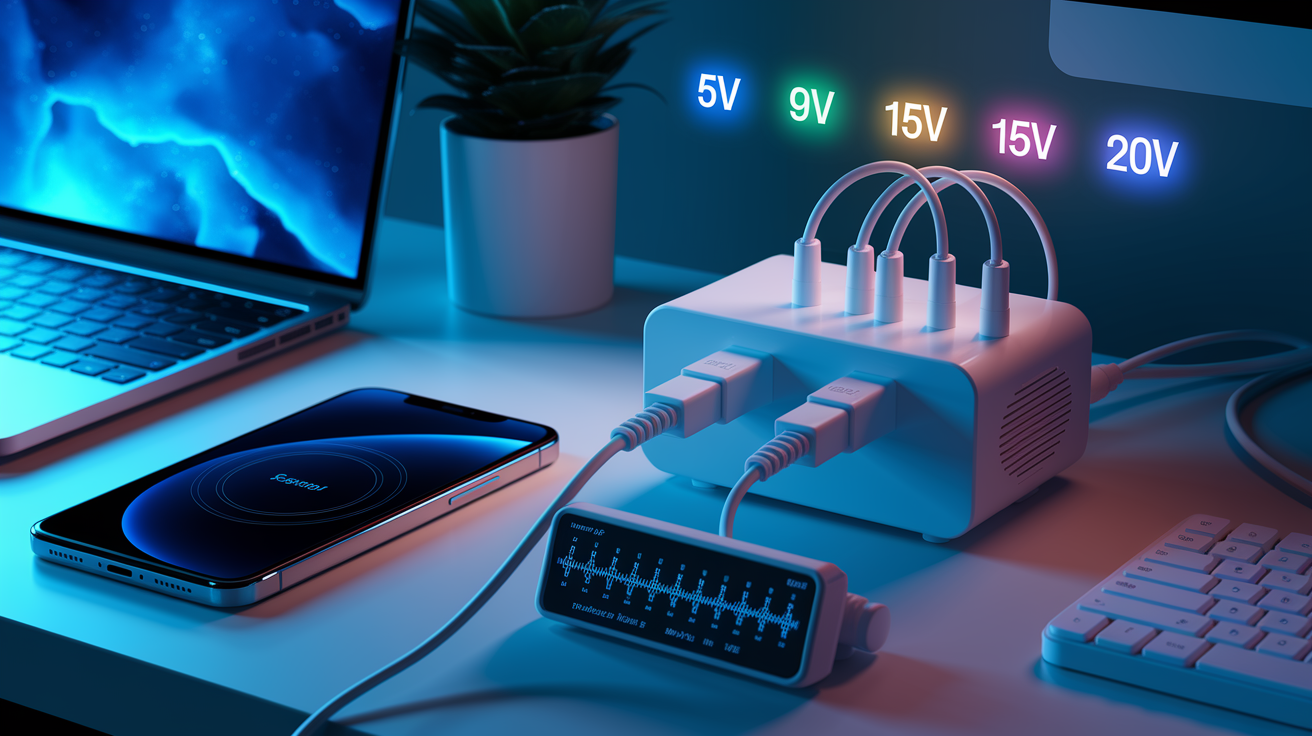
The charger brick sets the ceiling on voltage and current available to your device, but only if it speaks modern Power Delivery. USB PD negotiates dynamic voltage profiles (5V, 9V, 15V, 20V), letting the device ask for the combo that delivers peak wattage without crossing safety limits. Chargers without PD certification, or older models stuck at 5V and 2A, can’t fulfill that request. The session bottlenecks at 10W or less no matter if your device can handle 65W or 100W. Even PD-certified bricks vary. Pair a 30W charger with a 65W-capable device and you’ll never see more than 30W output, cutting real-world speed in half compared to a properly matched brick.
Cable quality matters just as much. USB-C cables have resistors inside that tell the charger and device how much current they can safely carry. Low-quality or non-certified cables might lack these resistors or use thin wire, forcing the system to fall back to the safest, slowest profile to avoid overheating. Resistive losses in cheap or long cables turn watts into heat, dropping delivered power at the device端 even when the charger端 shows full output. A meter at the charger might read 60W while the device端 gets only 45W, with 15W lost along the cable. PD-certified cables rated for 100W or higher cut this loss and lock in reliable negotiation across the full range of voltage profiles.
Programmable Power Supply (PPS) is an extension of PD that allows finer voltage steps (20mV increments) and real-time current tweaks, boosting efficiency and cutting heat during high-power sessions. PPS-compatible chargers and devices negotiate the ideal voltage continuously, skipping the stepwise jumps of standard PD profiles and squeezing a few extra percent of speed from the same wattage ceiling. Multi-port chargers split the load. Plug two devices into a 100W dual-port brick and power might split unevenly or drop per-port output below advertised maxes, slowing both sessions. Built-in safety limits (over-current, over-voltage, over-temperature protection) can also throttle output if the charger senses something abnormal, cutting speed to protect the hardware.
- PD voltage profiles: devices request 5V, 9V, 15V, or 20V. Non-PD chargers can’t supply higher voltages, capping wattage.
- PPS behavior: real-time voltage and current tuning in 20mV steps improves efficiency and cuts heat, yielding slightly faster real-world speeds.
- Cable resistance: thin or non-certified cables lose 10–25% of charger output as heat. PD-rated 100W cables minimize loss.
- Multi-port load sharing: total charger wattage gets divided among active ports. Individual port speed drops when multiple devices charge at once.
- Safety limits: chargers throttle or shut down output if over-current, over-voltage, or high temperature is detected, protecting both charger and device.
For more on how the device itself governs final charging speed through internal controllers, see The Real Truth About Fast Charging: Why Your Device Controls the Speed.
Launch-Day Marketing vs Everyday Charging Speeds: Case Comparisons

Marketing teams spotlight peak wattage or the steepest chunk of the charging curve, usually the first 10–20 minutes at low charge under perfect lab conditions. Headlines like “50% in 15 minutes” or “80% in 30 minutes” are technically possible but need a cool battery, a certified high-wattage charger, a quality cable, and zero background load. Real-world testing with normal usage (screen on, apps syncing, temperature doing its thing) consistently finds charge times 10–40% longer than the advertised number. The gap gets bigger on devices with any battery wear or when you’re using older, lower-wattage chargers left over from previous phones.
Peak power windows in actual use are short and fragile. A device might hit its advertised 65W for the first 10 minutes, then drop to 45W as internal temperature climbs and the battery management chip applies conservative limits. By the time you hit 70% charge, wattage might have fallen to 25W or lower, stretching the final 30% of the session way beyond the time implied by that early speed. Marketing language rarely mentions this taper, leaving you expecting steady performance across the whole 0–100% range when the real curve is heavily backloaded.
| Device | Advertised Claim | Average Real Result | % Difference |
|---|---|---|---|
| Flagship smartphone (65W capable) | 50% in 15 min | 42–45% in 15 min | 10–16% slower |
| Mid-range tablet (30W capable) | 80% in 45 min | 70–75% in 45 min | 6–13% slower |
| Laptop (100W capable) | 50% in 30 min | 40–46% in 30 min | 8–20% slower |
Practical Steps to Improve Fast Charging Performance in Daily Life
Getting closer to claimed speeds starts with matching your hardware to what the device can actually handle. Use a Power Delivery certified charger rated at or above the device’s max input wattage, and pair it with a PD-certified USB-C cable rated for 100W. This combo eliminates upstream choke points and lets the device negotiate its full voltage and current capability. Swapping out aging cables (even ones that look fine) can bring back lost speed, since internal resistance creeps up over time and chips away at power delivery. Double-check that multi-port chargers allocate enough wattage to the port you’re using. Lots of them split total output unevenly when multiple devices charge at the same time.
Thermal management makes a real difference. Charging in a cool spot, away from direct sun or heat sources, keeps battery temp in that sweet 20–25°C range and delays thermal throttling. Pull off thick cases during high-power sessions to help heat escape. For the fastest top-ups, close heavy apps, flip on airplane mode, or power off completely to wipe out background load. Routine charging between roughly 20% and 80% keeps the session inside the peak-power window and dodges the slow taper above 80%, where that final 20% can drag as long as the first 50%. This habit also cuts long-term battery stress, keeping health up and charging speed from tanking over the device’s life.
For context on why charging crawls in that final stretch and the thinking behind stopping around 80%, see When and How to Use DC Fast Charging.
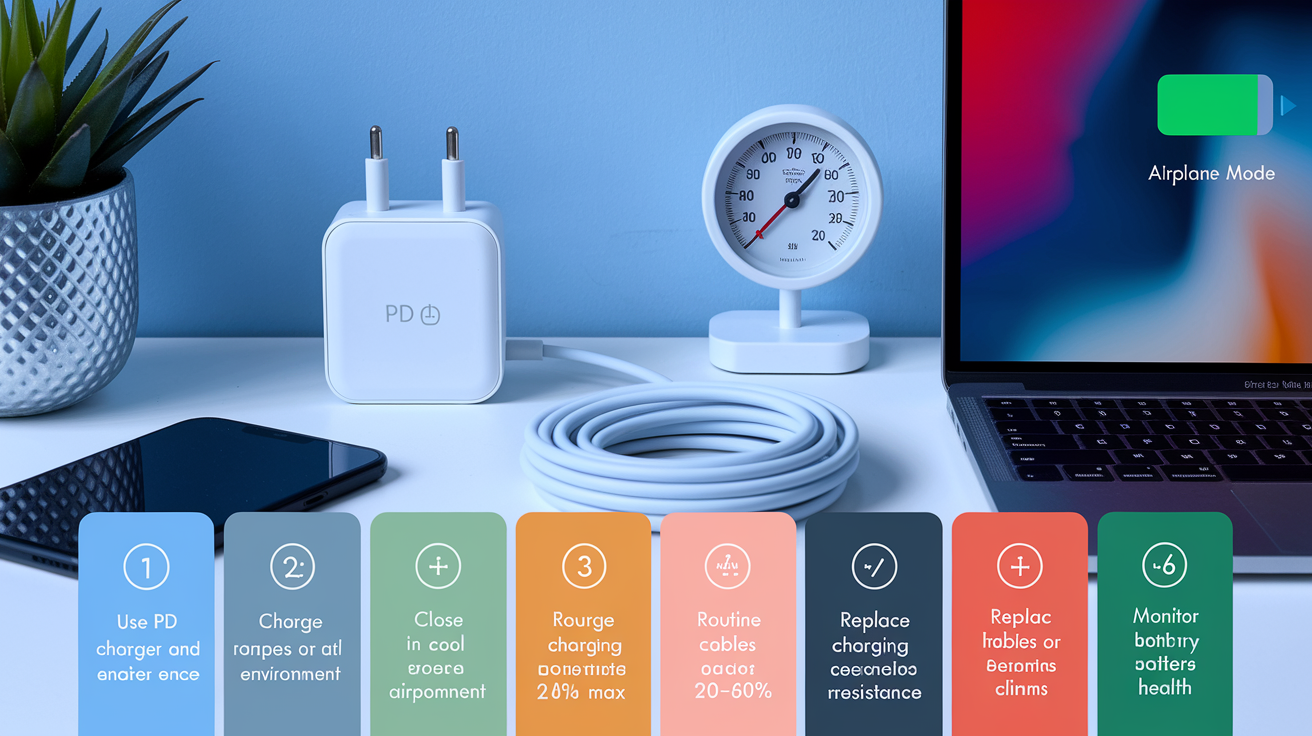
Six steps to keep peak daily charging performance:
- Use a PD-certified charger and cable rated at or above your device’s max input wattage.
- Charge in a cool environment (20–25°C) and ditch thick cases to improve heat dissipation.
- Close heavy apps or enable airplane mode to cut background load and boost net charge gain.
- Routine charging between 20–80% keeps sessions in the peak-power window and skips the slow final taper.
- Replace cables yearly or when resistance climbs. Even invisible internal wear slows charging.
- Monitor battery health and adjust expectations as capacity drops. Devices below 90% health won’t match launch-day speeds.
Final Words
We broke down why lab claims like “80% in 30 minutes” mainly describe a short peak window, not steady charging. Real-world results are typically 10–40% slower thanks to heat, cables, background apps, and battery age.
Use the simple fixes: keep the phone cool, use PD‑certified chargers and good cables, stick to 20–80% charging, and close heavy apps.
Watch how fast charging claims at launch translate to daily use, and you’ll get more reliable, faster top-ups without surprises.
FAQ
Q: What is the 30 90 rule for battery?
A: The 30 90 rule for battery means keeping charge between 30% and 90% state of charge to reduce wear and heat; it avoids deep discharge and the slow, stressful final 10% for better long-term health.
Q: Is 20W or 45W faster? Does 45W charge faster than 30W?
A: The 45W charger charges faster than 20W and usually faster than 30W, but actual speed depends on the device’s maximum acceptance, cable/charger quality, and thermal throttling that can cut peak power.
Q: How many minutes does it take to charge a fast charger?
A: Charging time with a fast charger varies: expect about 15–25 minutes to reach 0–50% on high-wattage setups, and roughly 30–60 minutes to hit 0–80% in real-world conditions because of tapering.